Main meniu
Main meniu
Main meniu
Je ne pense pas que la qualité du site Web sera bonne

Vous pouvez parcourir notre site Internet en français, ou continuer en anglais, en cliquant ci-dessous. Nous vous demanderons également de répondre à quelques questions pour nous aider à améliorer votre expérience.

Continue in english
Continuer en français
Why did you choose English?

We’d like to understand why the local language is not a good fit for you.

Why are you switching back to English?

We’d like to understand why the local language was not a good fit for you.

Vous quittez les pages de notre site web traduites en français

Comment trouvez-vous notre site en français ?

Omnisend research

Temu vs. Amazon: 
Price, trust, and competition

We recently analyzed product listings, pricing strategies, and consumer trust on two major ecommerce marketplaces: Temu and Amazon. The findings reveal not only a fierce price war between the two, but also concerns over brand imitation and potential review manipulation. Join us as we share our findings.

Key findings

Product overlap

77% of Amazon-listed products have close matches on Temu, with every tenth product being identical

Cost savings

Close matches on Temu are 40% cheaper on average, saving around $13.37 per product, while identical items have minimal price gaps

Brand imitation concerns

Many Temu products closely resemble well-known brands, often with blurred logos or modified packaging

Discount strategies

Temu offers steeper and more frequent discounts — up to 98% in some categories vs. 67% on Amazon

Consumer trust

Amazon maintains a major trust advantage, with products averaging 50,000 reviews per listing compared to just 1,500 on Temu

Potential review manipulation on Temu

Researchers noted disappearing reviews and poorly rated products being reuploaded, hinting at possible review manipulation

Category dominance

Temu excels in matching Amazon for Fashion & beauty items (94% match rate) but lags in Food & beverage

Where Amazon wins

Automotive is the only category where Amazon consistently offers lower prices, averaging 12% cheaper than Temu

How much of Amazon is
on Temu?

Amazon matches found on Temu

*A Temu item that shares key features and functions with an Amazon product, even if small
** The product is identical and from the same brand on both platforms.

Temu has a close match for 77% of Amazon-listed products, with one in 10 being identical on both platforms. Some categories see an even higher overlap — 94% of Fashion & beauty (Clothing, shoes & jewelry and Beauty & personal care) products have a near-identical Temu counterpart, while Food & beverages (Grocery & gourmet) has the lowest match rate.

Temu’s high product match rate positions it as a direct alternative to Amazon, offering nearly identical options often at lower prices. The big question is: will consumers prioritize a well-known and trusted brand, or a relatively new platform that offers greater savings?

How much can you really
save on Temu?

Average savings on Temu by category

*Positive value → Amazon is more expensive than Temu. Negative value → Temu is pricier than Amazon.

Shoppers can save an average of 40% by opting for Temu’s close matches instead of Amazon-listed products, translating to about $13.37 in savings per product. However, for identical products, the price gap is minimal (1%) — suggesting that Temu’s biggest advantage lies in alternative, not identical, options.

While Temu undercuts Amazon across most categories, there’s one surprising exception: Automotive products cost 12% less on Amazon than on Temu.

Brand or knock-off?

This research uncovered brand imitation concerns on Temu, with many products closely resembling well-known brands — but with tweaked packaging, blurred logos, or branding removed entirely. These attempts to mimic their name-brand counterparts raise questions about authenticity and quality.

For budget-conscious shoppers, the temptation is clear, but the trade-off might not be worth it. And for brands and retailers, this is a major concern — one that could shape future ecommerce regulations.

The discount game: Why
Temu feels cheaper

Temu’s pricing strategy isn’t just about lower base prices — it’s about bigger and more frequent discounts. While Amazon offers discounts on around 47% of its products, 65% of Temu’s listings are marked down. In addition to the stats above, some items see discounts as high as 98% on Temu, compared to Amazon’s highest discount being 67%.

Temu’s approach makes it seem like there are constant savings, making shoppers feel like they’re always getting a deal — even when some of those discounts are permanent, serving as a never-ending “sale” tactic.

Discounts offered on Amazon and Temu

Americans worry over tariffs. The survey also found that 42% are opposed to new tariffs on Chinese goods (34% are in favor, 24% undecided) and 56% of Americans are worried that the tariffs will drive up prices on Chinese goods.

Twenty-nine percent of Americans say that if prices go up on Chinese marketplaces like Temu, they would immediately stop buying or buy less. More than 20% said they would still shop there unless the increase is noticeable (20% or more).

Can you trust the
reviews?

When it comes to shopper confidence, Amazon dominates. The average Amazon product has 50,000 reviews, while Temu listings hover around just 1,500.

But more concerning is that our research uncovered potential review manipulation on Temu, with disappearing reviews and poorly rated products being removed and reuploaded under new listings. This raises questions about the reliability of customer feedback on the platform.

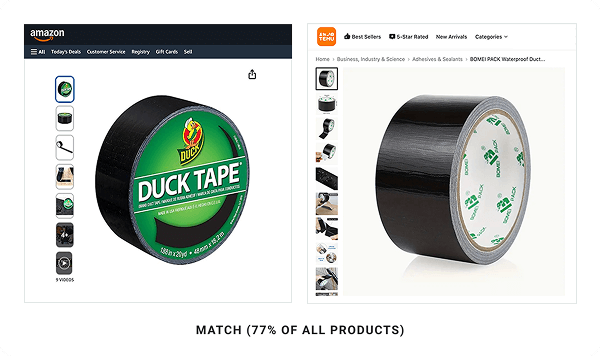
One possible explanation is that Temu could be prioritizing seller revenue and growth over transparency, potentially allowing sellers to erase poor reputations and inflate ratings, which may mislead consumers into buying seemingly high-rated products.

Alternatively, weak review monitoring might be enabling manipulation, giving sellers an unfair edge. Unlike Amazon’s stricter enforcement, Temu’s approach appears more opaque, raising possible concerns about accountability and consumer protection.

Greg Zakowicz
Sr. Ecommerce Expert at Omnisend
Methodology

Omnisend’s research examined 23 product categories, analyzing the top 25 best-selling products in each category to ensure representative findings. Temu products were classified into three groups:

  • Match (77%) – products similar in function and attributes to those on Amazon
  • Perfect match (10%) – identical Amazon products available on Temu under the same brand
  • Global brand product (13%) – Amazon-listed products from well-known brands that Temu has matched with either an exact or alternative product

Key data points collected included pricing trends, discount rates, number of reviews, and sale status. Amazon-exclusive items were excluded to maintain objectivity. The timing of the research: Dec. 1, 2024 — Jan. 31, 2025.

We’ve done our best to ensure the accuracy of the numbers in this report based on our given methodology, but we can’t guarantee they’re 100% precise. These figures should be taken as insights rather than absolute facts.

All collected data is available in .xlsx format here.

Have any questions?

Reach out to our Public Relations team by email [email protected] for more details. We're here to help and provide any additional information you might need.

Omnisend

Email and SMS marketing so good, it’s boring

Omnisend is a leading email and SMS marketing platform, trusted by over 125,000 brands worldwide and with a 4.7-star rating from more than 6,000 Shopify reviews. With powerful tools like automation, segmentation, reporting, push notifications, and product reviews, Omnisend merchants generate $68* for every $1 spent.

Learn more

Get plan recommendation