
 OFFER
OFFER


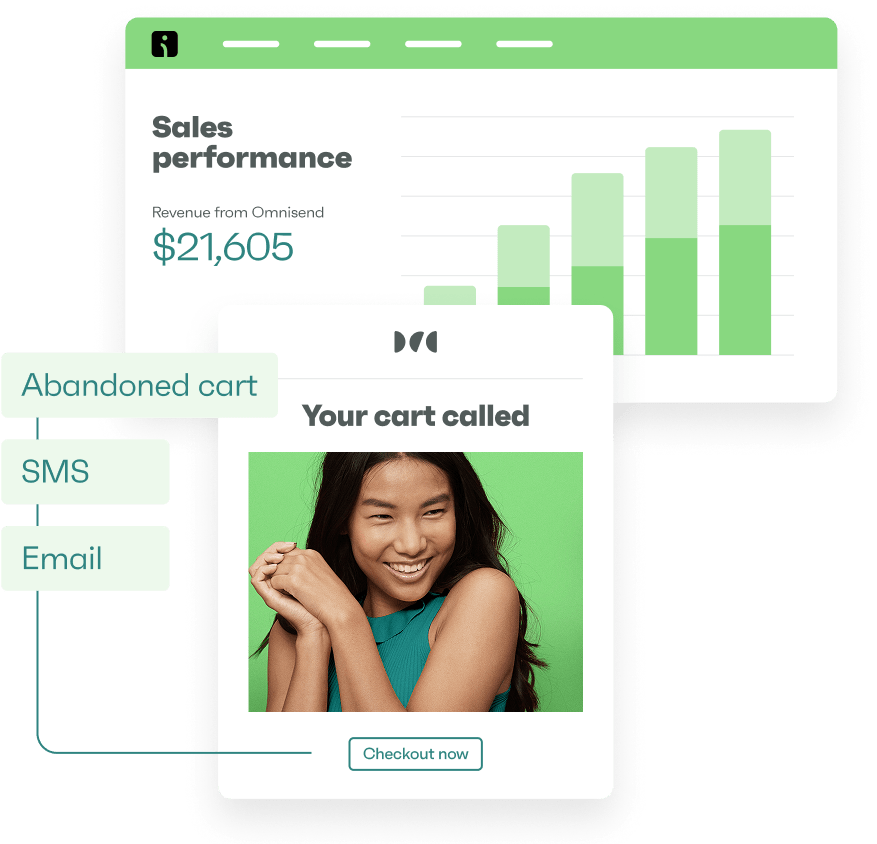
Drive sales on autopilot with ecommerce-focused features
See FeaturesOmnisend analyzed 246M+ SMS campaign sends and 20M+ SMS automation sends across 27,000+ brands in 2025 to create these SMS marketing benchmarks for 2026.
The data shows what ecommerce brands can expect from SMS campaigns, how automated SMS messages compare to one-off campaign sends, and how SMS performance stacks up against email. It also gives teams a clearer way to judge their own click-through rate, conversion rate, deliverability, and revenue per message.
That matters more now that SMS is becoming easier to test at scale. Omnisend’s recent SMS pricing drop gives brands more room to include texts in their campaign and automation mix. At the same time, the full 2026 ecommerce marketing report shows how SMS fits into the wider email, SMS, and push performance picture.
The first step is to look at the overall campaign averages, then compare SMS automations with campaign sends and email performance.
Compare SMS performance with Omnisend
Quick sign up | No credit card required
SMS marketing benchmarks at a glance
All figures in this section come from Omnisend’s 2025 dataset of SMS campaign sends.
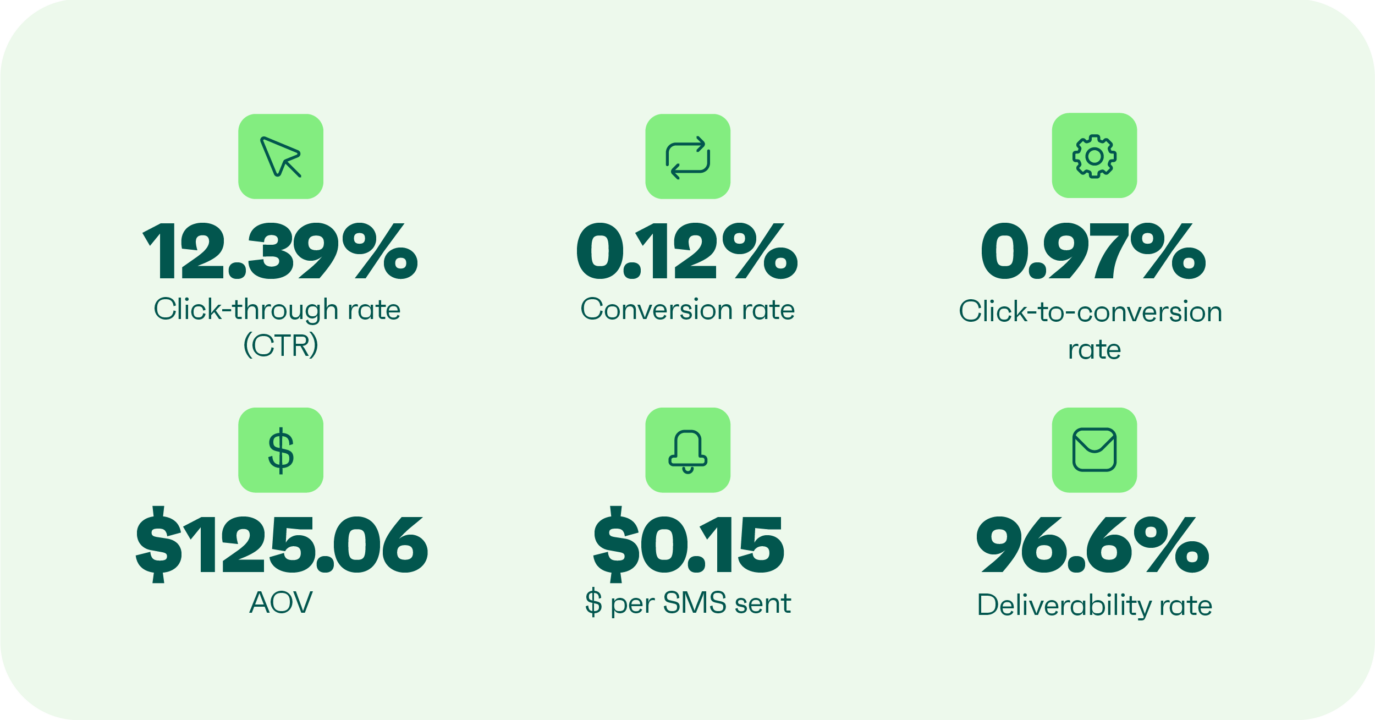
These are overall campaign averages across 246M+ SMS sends. They’re useful as a starting point for teams already tracking SMS performance, and for brands building a wider SMS marketing program from scratch.
The biggest gap is in clicks. SMS campaigns averaged a 12.39% CTR, while email campaigns averaged 0.74%. That’s the advantage of a short message that shows up directly on a subscriber’s phone.
The 96.6% deliverability rate also shows why SMS behaves differently from email. Texts avoid many email-specific hurdles, including subject lines, promotions tabs, and spam filtering, though brands still need clean lists and compliant sending practices. Omnisend’s SMS marketing statistics guide has more data for teams deciding how SMS fits into their marketing mix.
The next sections break down monthly CTR patterns, compare SMS automations with campaign sends, and show how SMS performance stacks up against email.
SMS click-through rate benchmarks
Click-through rate is the main engagement metric for SMS. Unlike email, SMS doesn’t have an equivalent open rate, so CTR is the clearest way to see whether subscribers are interested enough to tap through.
Across Omnisend’s 2025 SMS campaign dataset, the average CTR was 12.39%. That annual figure is useful, but it also hides a lot of movement across the year.
| Month | CTR | Conversion rate | $ per SMS |
|---|---|---|---|
| January | 3.47% | 0.13% | $0.148 |
| February | 5.93% | 0.13% | $0.169 |
| March | 6.33% | 0.14% | $0.183 |
| April | 7.41% | 0.14% | $0.173 |
| May | 5.19% | 0.12% | $0.133 |
| June | 5.34% | 0.12% | $0.166 |
| July | 6.76% | 0.11% | $0.145 |
| August | 5.85% | 0.10% | $0.128 |
| September | 11.82% | 0.11% | $0.139 |
| October | 18.02% | 0.10% | $0.133 |
| November | 20.28% | 0.13% | $0.162 |
| December | 23.92% | 0.12% | $0.147 |
| Annual | 12.39% | 0.12% | $0.150 |
The clearest pattern is the climb toward the end of the year. CTR starts at 3.47% in January, reaches 11.82% in September, then rises sharply to 18.02% in October, 20.28% in November, and 23.92% in December.
The jump toward November and December follows the usual ecommerce rhythm. BFCM, holiday gifting, and year-end sales give brands more reasons to send SMS campaigns — and subscribers more reasons to click. For teams monitoring SMS marketing ROI, those months are when cost, click volume, and revenue per message should be reviewed together.
Conversion rate doesn’t move in the same way. It remains between 0.10% and 0.14% throughout the year, even as CTR rises from 3.47% in January to 23.92% in December.
So, more clicks don’t automatically mean the same lift in purchases. Holiday shoppers may be more willing to tap through, but they’re also comparing more offers, browsing more stores, and getting more promotional messages. That puts more pressure on the offer, landing page, and targeting. Omnisend’s guide to SMS marketing conversion rate covers this purchase side in more detail.
SMS automations vs. campaign sends
Automations come out ahead in this comparison. Campaign sends averaged a 12.39% CTR and $0.15 per message, while automated SMS reached 20.34% CTR and $0.75 per message.
That fits the pattern we see in email marketing benchmarks, too. Triggered messages usually have better timing because they follow something the customer just did, rather than going out to a broad list all at once. SMS makes that timing even more noticeable because the message can reach the subscriber almost immediately.
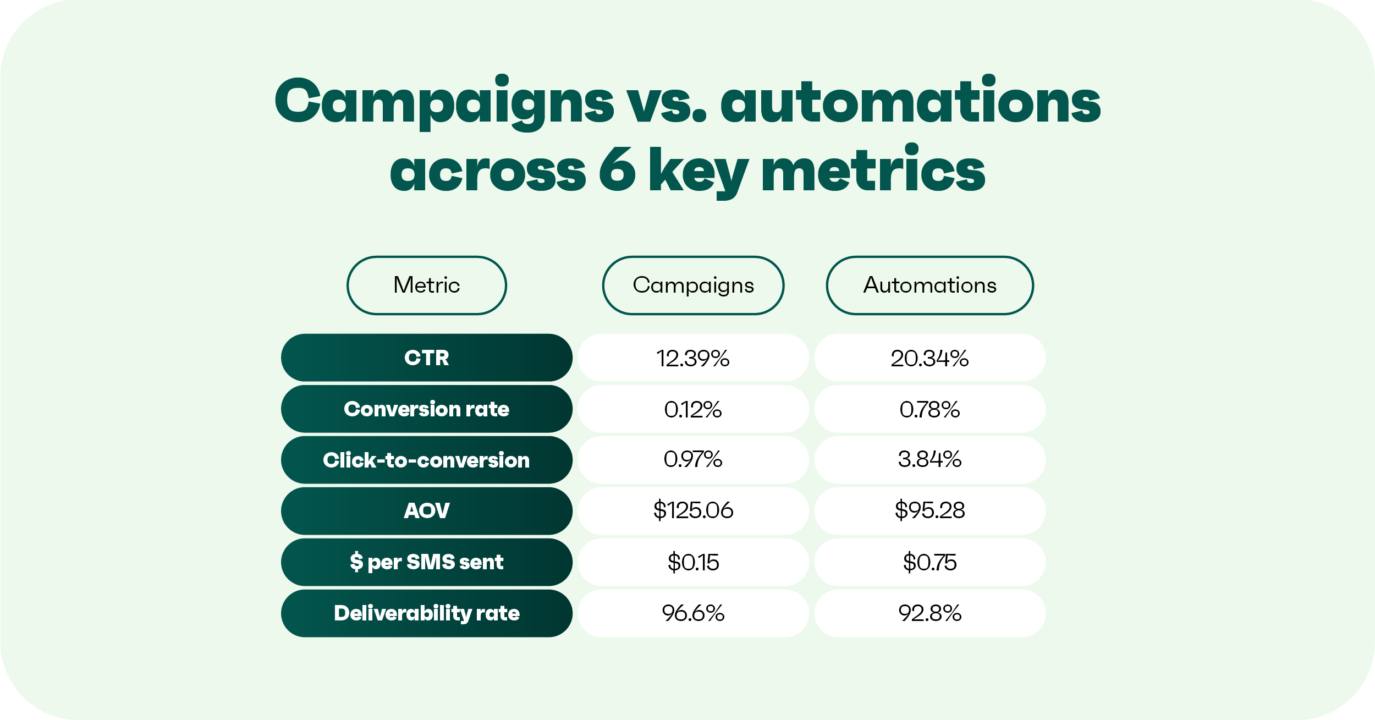
The conversion rate gap is one of the clearest differences: 0.12% for campaigns compared to 0.78% for automations. That comes down to timing. A campaign send goes to the target audience at a specified time. In contrast, an automated SMS is triggered by a specific action, such as joining a list, abandoning a cart, or completing a purchase.
That makes SMS marketing automation more relevant by default. The message is connected to something the subscriber just did, so it has a better chance of matching their intent.
AOV tells a different story. SMS automations averaged $95.28, while campaigns averaged $125.06. This likely reflects the role each message type plays: automations often recover or follow up on lower-value purchases, while campaign sends are more likely to promote seasonal offers, product launches, or higher-ticket deals.
Deliverability also needs attention. Campaigns had a 96.6% deliverability rate, compared to 92.8% for automations. Automations also showed an 11.8% bounce rate — 6.7% hard bounces and 5.2% soft bounces. Since soft bounces are often retried and may still deliver, the final deliverability rate lands at 92.8%. The hard bounce figure is the one worth monitoring: automated workflows can keep running for months while invalid numbers accumulate in the background.
That’s less likely with campaign sends, which often go to more recently validated lists. Teams using both automation and mass texting services should review list quality regularly before peak promotional periods.
The 5x revenue-per-message gap reinforces the main takeaway: when messages respond to subscriber behavior, they tend to generate more revenue.
SMS vs. email: how the channels compare
Marketers running both SMS and email eventually ask the same question: which channel performs better?
Omnisend’s dataset covers both channels within the same brand base, enabling direct comparison. Instead of comparing SMS results from one platform with email results from another, this data shows how both channels performed across the same ecommerce brands.
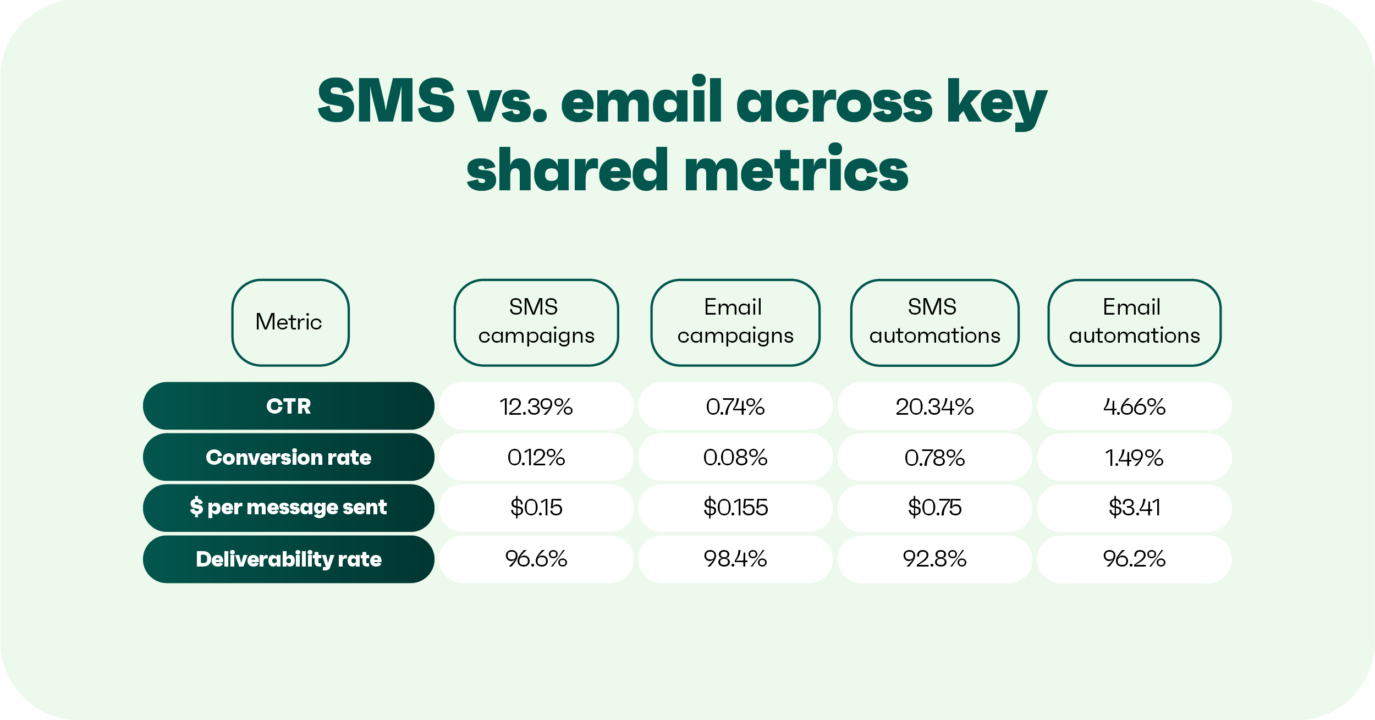
SMS wins clearly on CTR. SMS campaigns averaged a 12.39% CTR, compared to 0.74% for email campaigns. SMS automations also outperformed email automations on clicks, with a 20.34% CTR compared to 4.66%.
Part of the CTR gap comes down to where the message appears. A text appears on the subscriber’s phone, without a subject line, promotions tab, or a crowded inbox around it. Email has more room for visuals, product recommendations, and longer offers, but SMS requires a click much faster.
Conversion rate is closer at the campaign level: 0.12% for SMS campaigns and 0.08% for email campaigns. Once automation enters the picture, email pulls ahead. Email automations reached a 1.49% conversion rate, compared with 0.78% for SMS automations.
This is where email starts to pull ahead. SMS can get a quick response, especially for a short deadline or a sale reminder. Email has more room to handle the next step — product details, reassurance, recommendations, and the extra context someone may need before buying.
On revenue per message, email automations lead by a wide margin: $3.41 per send versus $0.75 for SMS automations. Still, the more useful question is what each send costs and what it’s trying to achieve. SMS can be valuable for fast action, but its higher send cost makes margin and campaign goal part of the calculation.
SMS and email work better when they aren’t doing the same job. SMS fits short, urgent messages. Email works better for product stories, recommendations, and follow-ups that need more room.
Why tracking SMS benchmarks matters
Benchmarks are more useful as a troubleshooting tool than as a fixed target. They help you spot where performance may be leaking.
If your campaign CTR is far from 12.39%, start with the basics: list quality, audience size, offer clarity, and send time. Timing can be especially important during holidays, flash sales, and other short promo windows, so Omnisend’s guide to the best time to send SMS is worth checking.
Benchmarks also stop SMS and email from being judged by the same job. SMS can get quick attention. Email can give the details shoppers need before they buy. When both are measured together, it’s easier to see which channel should handle each part of the customer journey.
Omnisend helps ecommerce brands track and improve SMS and email performance from one platform, so teams can compare campaign results, automation performance, and revenue across channels without switching between separate tools.
Track SMS and email performance with Omnisend
Sign up today
Quick sign up | No credit card required
TABLE OF CONTENTS
TABLE OF CONTENTS

Subscribe and don’t miss any updates!
No fluff, no spam, no corporate filler. Just a friendly letter, twice a month.