
 OFFER
OFFER


Research

Drive sales on autopilot with ecommerce-focused features
See FeaturesClicked. Bought. Delivered… and then it’s gone.
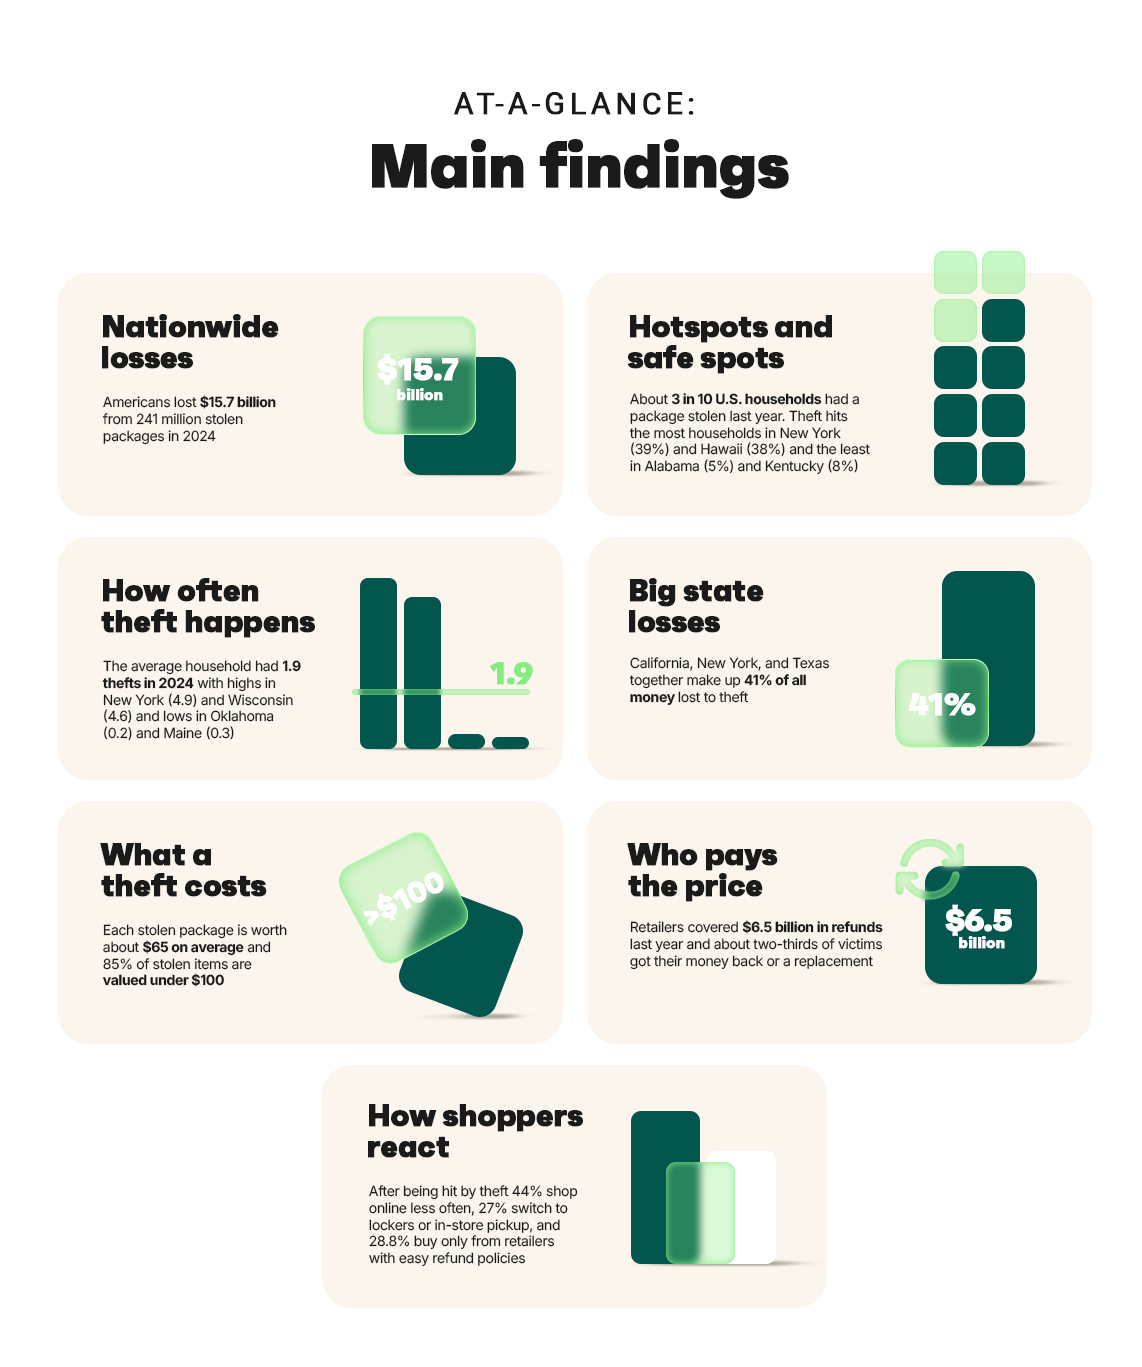
That’s the reality for nearly 1 in 3 U.S. households right now. Package theft isn’t just an occasional headache — it’s a $15.7 billion problem, with 241 million parcels stolen in 2024 alone.
Some states are drowning in porch piracy (looking at you, New York). Others barely feel it. Most stolen items are cheap on their own, but add them up, and retailers and consumers are facing an enormous bill.
To move beyond underreported police records, we blended FBI crime data with a national consumer survey, then modeled the full financial hit – and the picture became clear. Here’s the state of porch piracy in America in 2024.
Where theft hits hardest
Package theft doesn’t hit every doorstep equally.
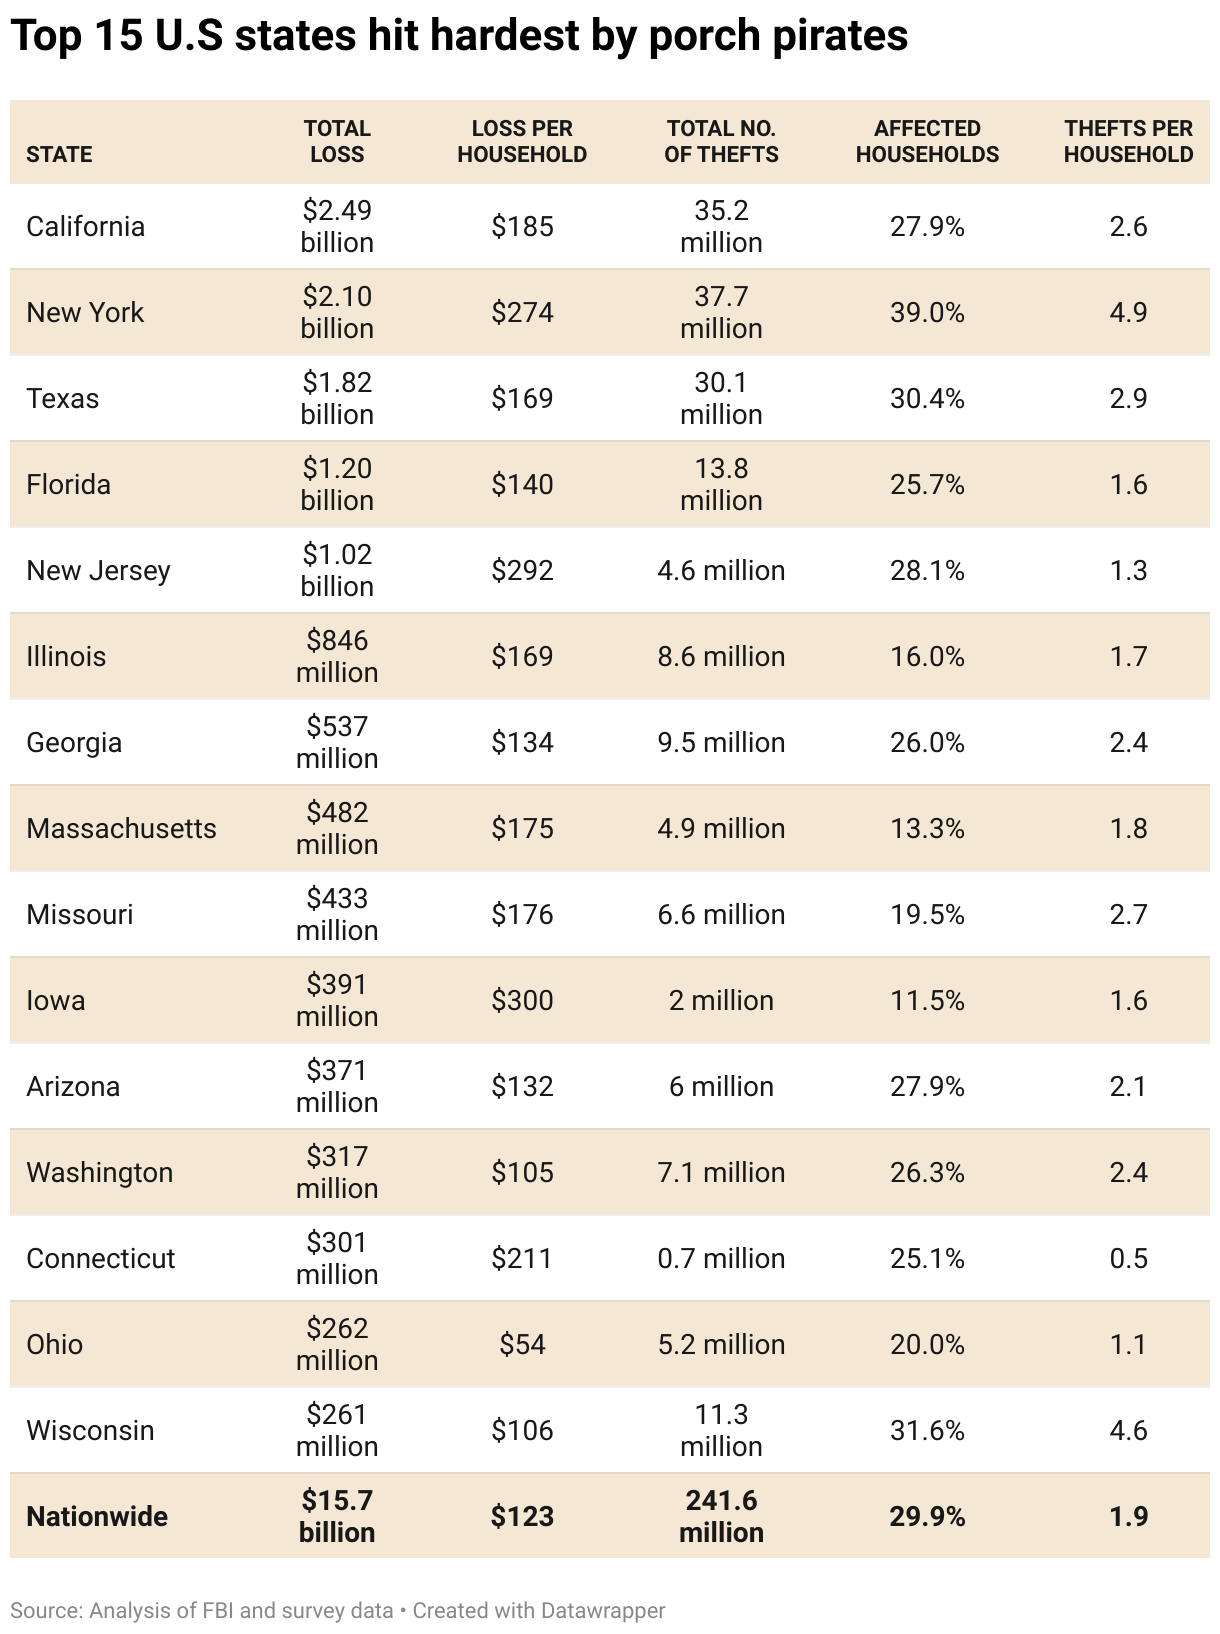
By raw dollars, California, New York, and Texas dominate — together responsible for 41% of national losses. California alone racked up nearly $2.5B in stolen goods.
But when you zoom in on households, the story shifts. New York (39%) and Hawaii (38%) top the list for share of households hit. Meanwhile, states like Alabama (5%) and Kentucky (8%), and Louisiana (11%) are relative cold spots.
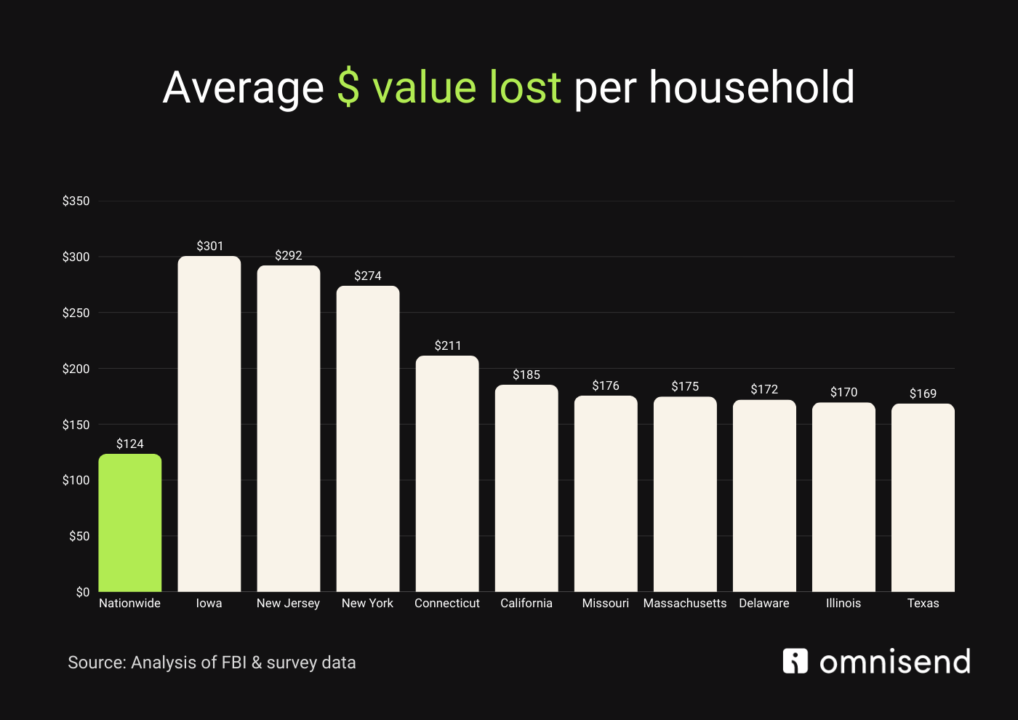
Some states bleed more per household too. New Jersey and Iowa averaged nearly $300 in annual theft losses per home, the steepest in the country.
How often it strikes — and what’s stolen
On average, U.S. households experienced 1.9 thefts in 2024. For households that were hit, the problem stacked up quickly: victims lost an average of 6.37 packages each.
Most thefts are “small” on paper — 85% of stolen items are under $100, and the average value of a stolen package is $64.87. And they do seem like small numbers — until you multiply them by 241 million missing parcels.
That’s how you end up with a $15.7B problem.
Moreovoer, some states see far higher theft intensity. New York households averaged 4.9 thefts, and Wisconsin 4.6. At the other end, Oklahoma (0.2) and Maine (0.3) barely registered.
Who pays — and how shoppers respond
When a package disappears, someone’s footing the bill. And “shockingly”, it’s almost never the thief:
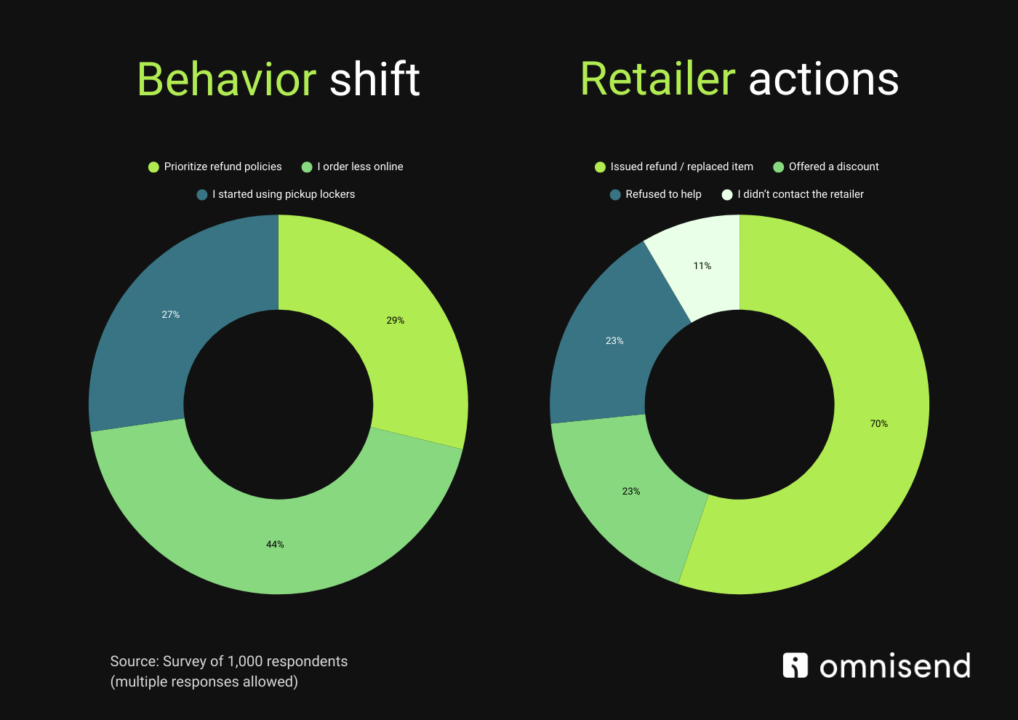
- Retailers covered $6.5B in refunds last year
- About 70% of victims got their money back, while 23% of retailers refused responsibility altogether
- Amazon topped the list (71.9% of thefts involved its deliveries), with UPS (31.3%), FedEx (29.7%), and USPS (28.8%) also frequently cited
For shoppers, this isn’t just a one-off matter of annoyance. This genuinely changes their habits:
- 43.9% say they order online less often
- 27.3% switch to lockers or in-store pickup
- 28.8% buy only from retailers with easy refund policies
In other words, thieves aren’t just stealing stuff — they’re stealing confidence in ecommerce itself.
What it all means
Package theft is no longer about the unlucky few. It’s a mainstream risk, and it’s baked into the cost of ecommerce.
With 30% of households hit, nearly two thefts per home, and retailers eating billions in refunds, porch piracy is a systemic problem.
The big three states (California, New York, Texas) lose the most in dollars. But states like Iowa and New Jersey feel it hardest per household. Meanwhile, safe zones like Alabama or Kentucky show that prevention (or luck) is possible.
For consumers, the playbook is shifting: buy less, pick up more, and shop where refunds are simple. For retailers and carriers, it’s time to admit the obvious: last mile isn’t working.
Until it does, consider $15.7 billion the annual price of porch piracy.
Methodology
Crime data from the FBI
In mid‑August, we scraped the FBI’s state‑by‑state database of reported crimes, focusing on the category “other larceny,” which typically includes package theft. To ensure relevance, we filtered for incidents recorded at Residences/Homes. Because not all police departments report data, we scaled totals based on the population share covered by participating agencies.
Nationally representative consumer survey
In parallel, we conducted a survey of 1,067 U.S. adults capturing whether respondents experienced package theft in the past 12 months, how many packages were stolen, reporting behavior (to police), dollar value of losses, and what happened next (retailer response and behavior changes).
Adjusting and aligning the data
We adjusted FBI state estimates using the survey’s state‑level reporting rates to account for thefts that go unreported. We then assigned monetary values to the FBI theft estimates based on the average loss per incident reported in the survey.
Calculating final estimates
We then calculated totals of thefts and dollar losses directly from the survey to provide a second benchmark. Finally, we produced our final figures by taking a weighted average of both sources: survey data was given 75% weight and FBI data 25%. This blended approach allows us to account for both the documented crime landscape and the true consumer experience, creating a fuller picture of package theft in the U.S.
TABLE OF CONTENTS
TABLE OF CONTENTS

Subscribe and don’t miss any updates!
No fluff, no spam, no corporate filler. Just a friendly letter, twice a month.