
 OFFER
OFFER


Drive sales on autopilot with ecommerce-focused features
See FeaturesKey takeaways
Marketing reports are essential for evaluating campaign performance and making informed decisions based on real data, rather than assumptions.
Different types of marketing reports, such as campaign performance and digital marketing reports, help identify trends, gaps, and areas for improvement in your strategy.
Regularly reviewing marketing reports fosters team alignment and ensures everyone is working towards the same goals.
Automating your marketing reports with tools like Omnisend streamlines data collection and analysis, allowing for quicker insights and better decision-making.
Reveal key takeaways
How do you know if your marketing is actually working? Marketing reports help answer that question. They show how your campaigns perform using metrics like clicks, sales, conversions, and engagement.
With them, you can track results, measure goals, and understand what is working and what is not. More importantly, you can make decisions based on real data instead of guesswork.
Businesses use marketing reports not only to review results but also to spot patterns, find gaps, and plan better next steps. When teams review reports often, it is easier to stay aligned and work toward the same goals.
Tools like Omnisend make reporting easier by putting all your marketing data in one place and automating reports. This saves time and helps you see results faster.
In this article, you will learn the main types of marketing reports and see simple examples. You will also understand how to create reports that lead to better decisions.
Create marketing reports that track your marketing campaigns with Omnisend today
Quick sign up | No credit card required
Quick answer: What is a marketing report?
A marketing report is a summary of data from different sources. This data reveals how your marketing campaigns are doing.
It brings together data like sales, clicks, signups, conversions, and revenue in one place. This makes it easier to measure progress and understand how your marketing affects your business.
For business owners, marketing reports are helpful tools. They help you understand your customers and see whether your ad spend is profitable. Using marketing reports and insights, you can determine what is working for your company and what needs to change.
Why marketing reports matter for business growth
Marketing reports are the building blocks of an ecommerce strategy. They may offer insights into what led to last week’s sales increase or to a failed marketing campaign. For example, a report can show that your social media ads drive traffic, while email automations generate most of your conversions.
Here are two major reasons marketing reports matter:
Tracking performance and ROI
Marketing reports make it easier to measure campaign performance across different channels. You can see which campaigns generate the most clicks, conversions, and revenue. They also reveal which campaigns need improvement.
Making data-driven decisions
Good reporting shows you what is actually working. This helps you reach the right customers, improve messaging, and get better ad results. This way, your decisions will be guided by facts and not assumptions.
Types of marketing reports you should know
There are many different marketing reports you can use. Each one plays a key role in showing you exactly how well your business plans are working. Knowing the types of marketing reports helps you build a better marketing strategy.
Together, these reports show how your marketing is doing and where you can improve.
Campaign performance reports
Campaign performance reports are centered on a single marketing activity. These reports show you how well a specific plan is working compared to the goals you set for it.
These reports usually track marketing metrics like clicks, conversions, impressions, revenue, and engagement. These reports are especially useful after a campaign ends. They help you quickly see what performed well and what did not.
Monthly marketing reports
The monthly marketing report provides a broader picture of performance for a given month. It is used when making budgeting and priority-setting decisions for the next month.
They help you spot trends and compare your monthly growth. This makes it easier to decide how to spend your budget and what to focus on first. They are also useful for identifying seasonal changes in customer behavior.
Digital marketing reports
This report brings together information from various online channels. It includes data from your emails, texts, social media, paid ads, and website visits. They give you a complete picture of how your digital ecosystem is performing.
A good marketing report displays verifiable facts. It provides clear details about who is viewing your content on each platform. It shows how these channels work together, making it easy to identify what’s working and where to improve.
Digital marketing reports are key to seeing how all your different platforms work together. They help you identify which channels deliver the highest ROI and how customers move through your funnel.
Marketing analysis reports
This type of marketing report goes beyond simple data collection to find deep insights. It analyzes data, finds trends, and uncovers patterns that help guide business plans.
They focus on trends, patterns, and deeper insights that can shape your strategy. These reports help you understand why your sales or clicks are changing, rather than just showing you the numbers. This helps you understand the reasons behind your success or any problems.
Marketing report examples to inspire your strategy
Marketing reports become more powerful when you can see them in action.
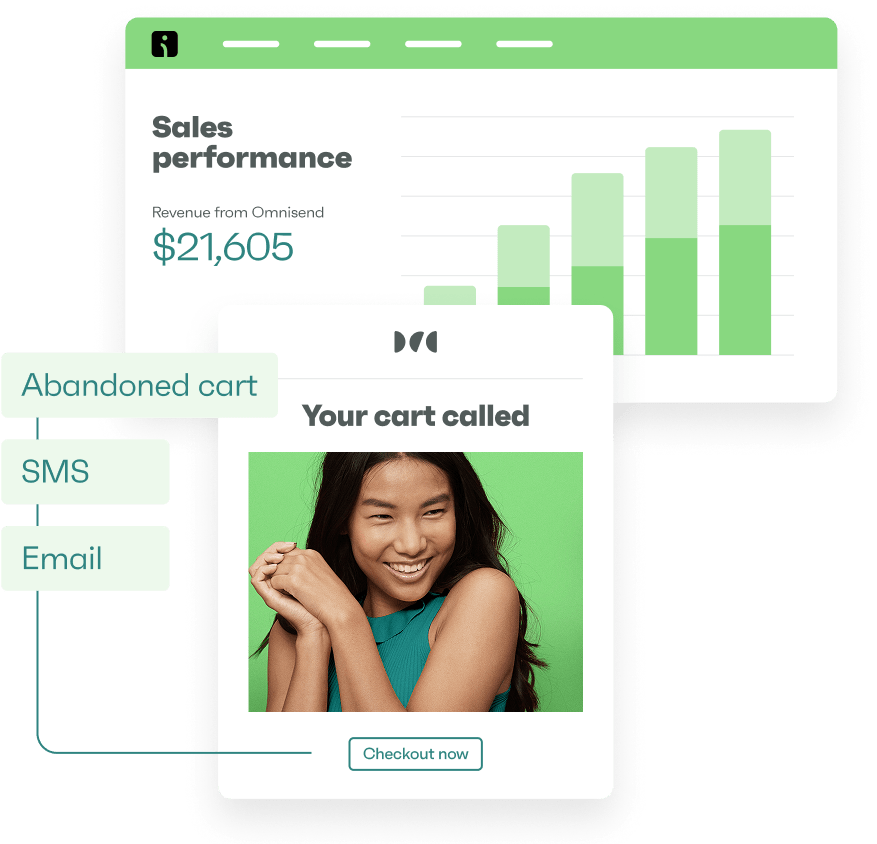
With platforms like Omnisend, you can view performance across email, SMS, and automation campaigns in one place. This gives you a clearer view of how your marketing channels work together.
 | “From our success manager to training seminars and playbooks, Omnisend has truly helped us grow.” – Jacqueline Love, Ecommerce and Wholesale Manager, Rachel Riley See how Rachel Riley used Omnisend to achieve 77% year-over-year increase in BFCM revenue growth through automation and omnichannel marketing Read the full story here |
The following marketing report examples show how marketers use reporting to improve results across the customer journey.
Campaign performance report example
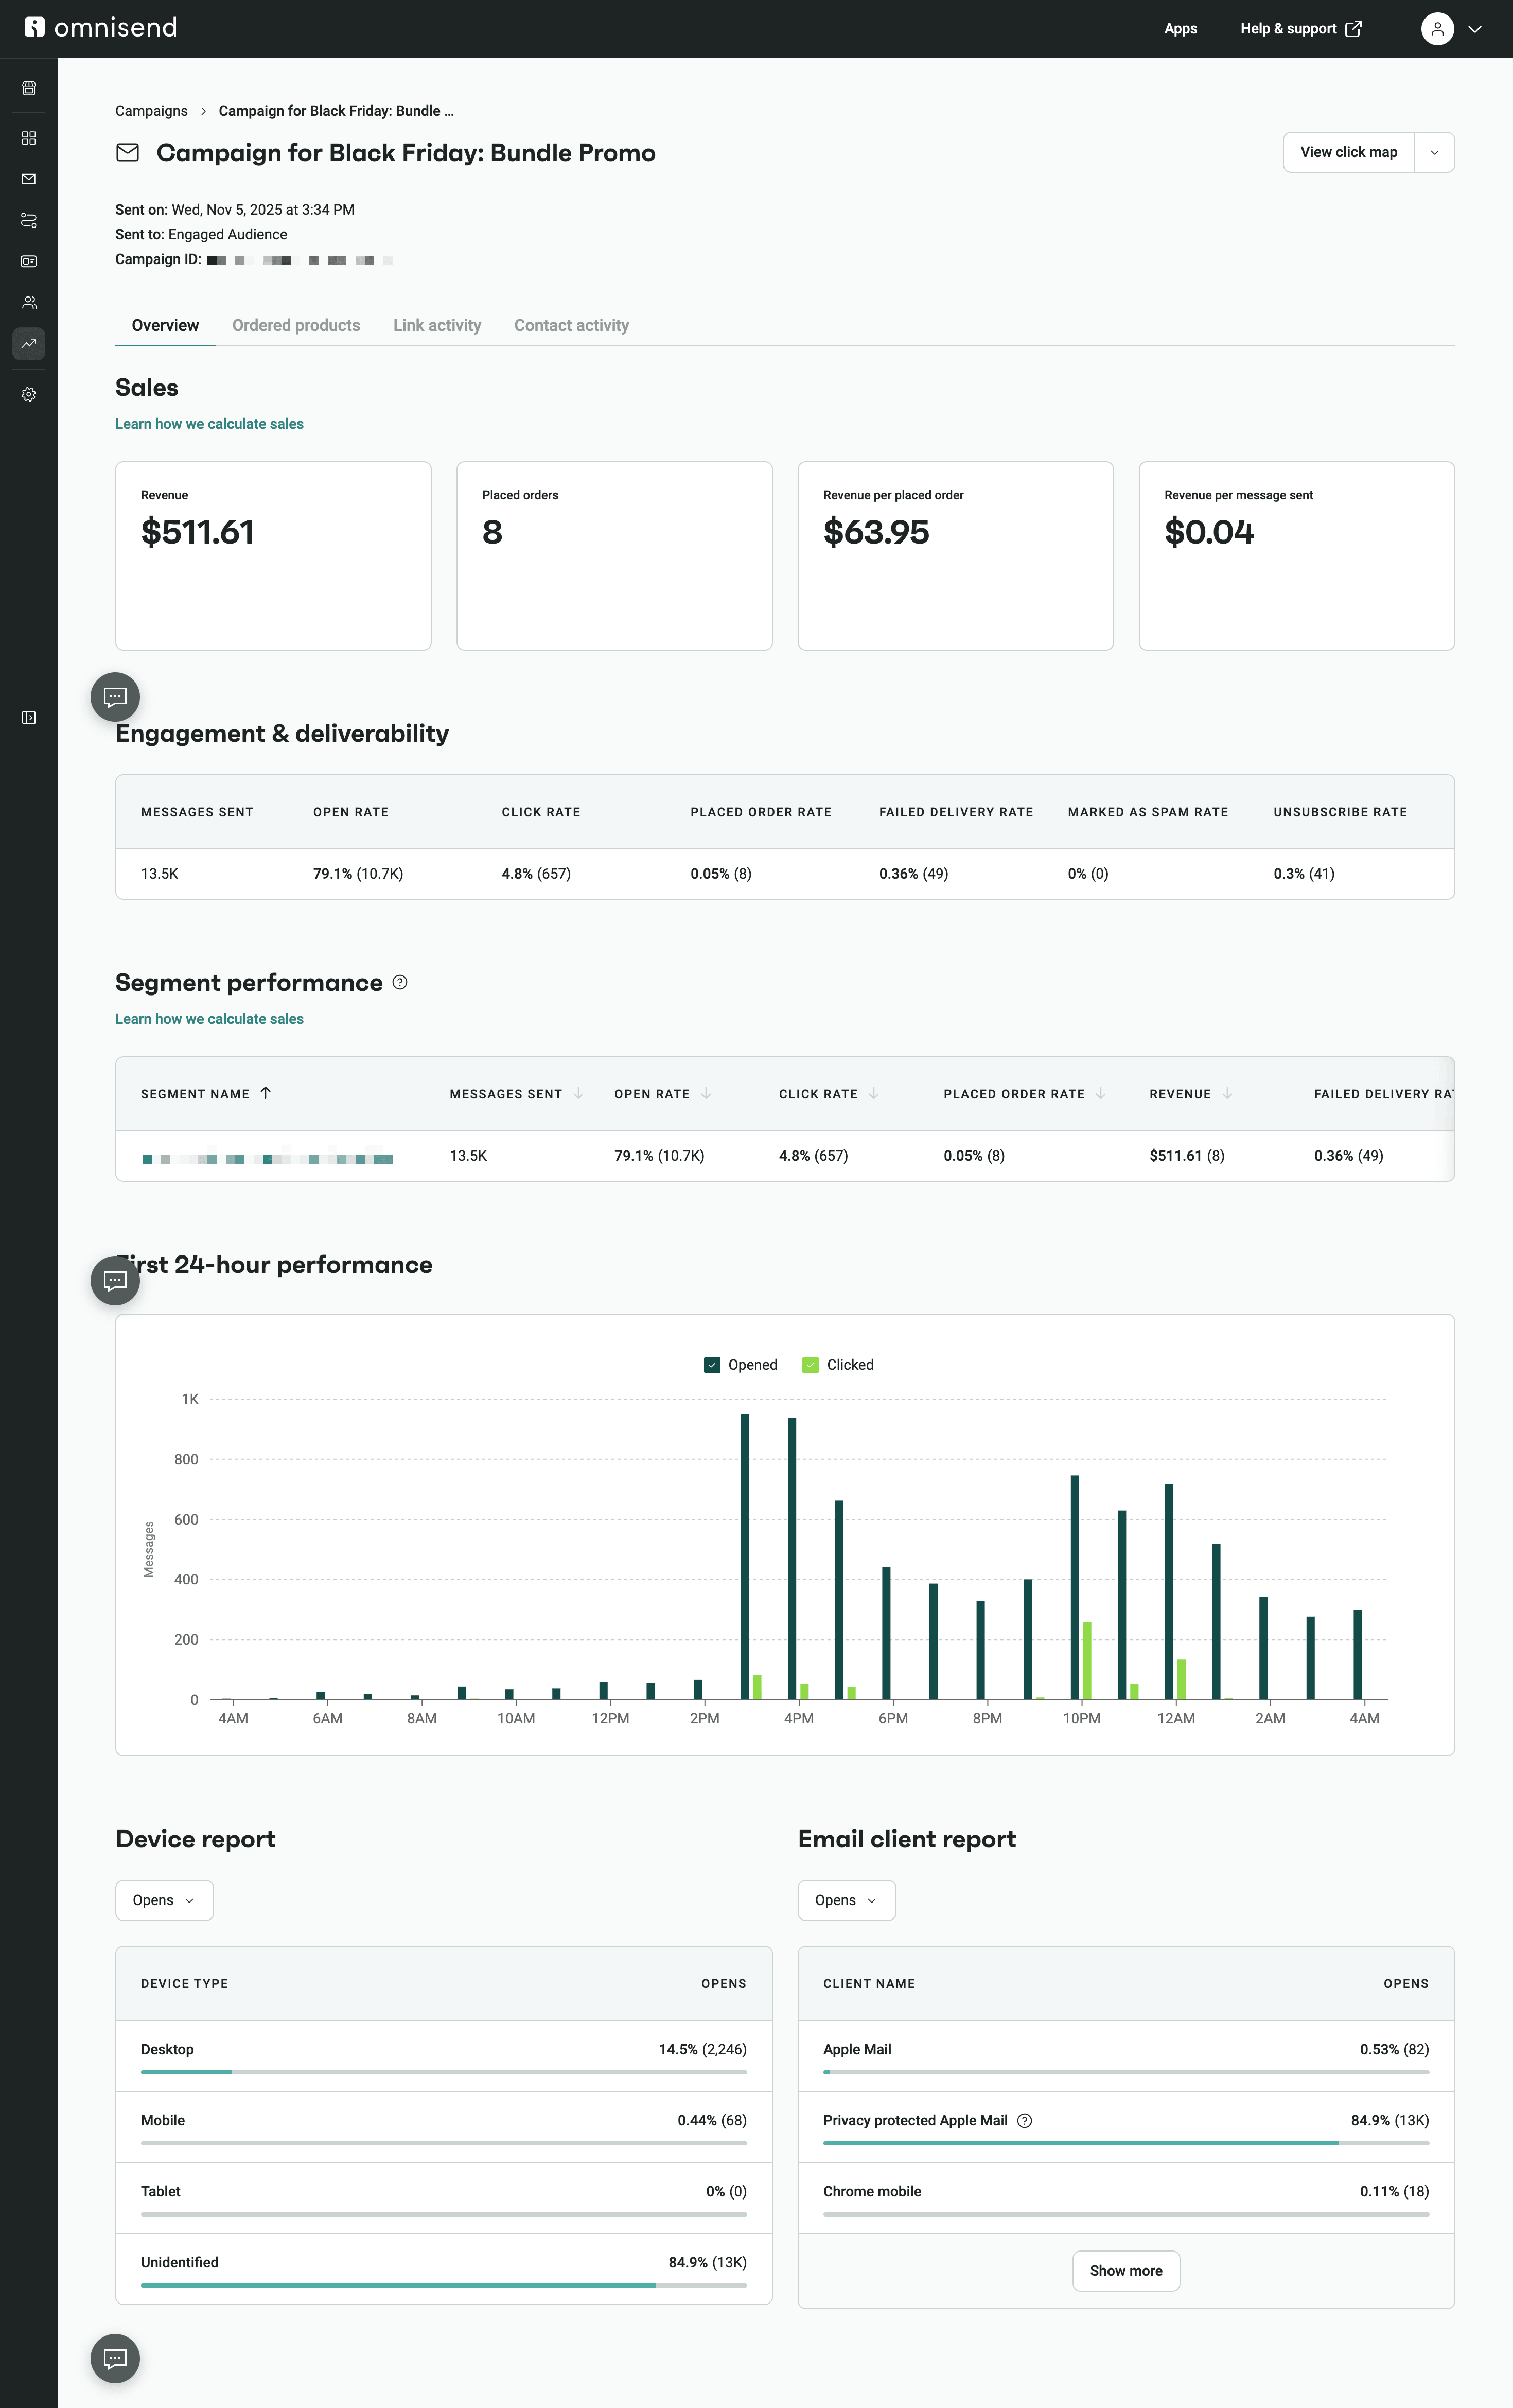
Campaign reports show key metrics, such as how many people opened your emails, clicked your links, and made a purchase. They also show how much money a specific project made.
Comparing campaigns side by side helps you identify what resonates with your audience. For example, one email subject line may generate higher engagement, while another may drive more sales.
By analyzing this data, you can invest your time in the right strategy to drive the most growth. This screenshot is an example of a marketing campaign report. It shows how well an online store’s Black Friday sale performed:
Automation performance report example
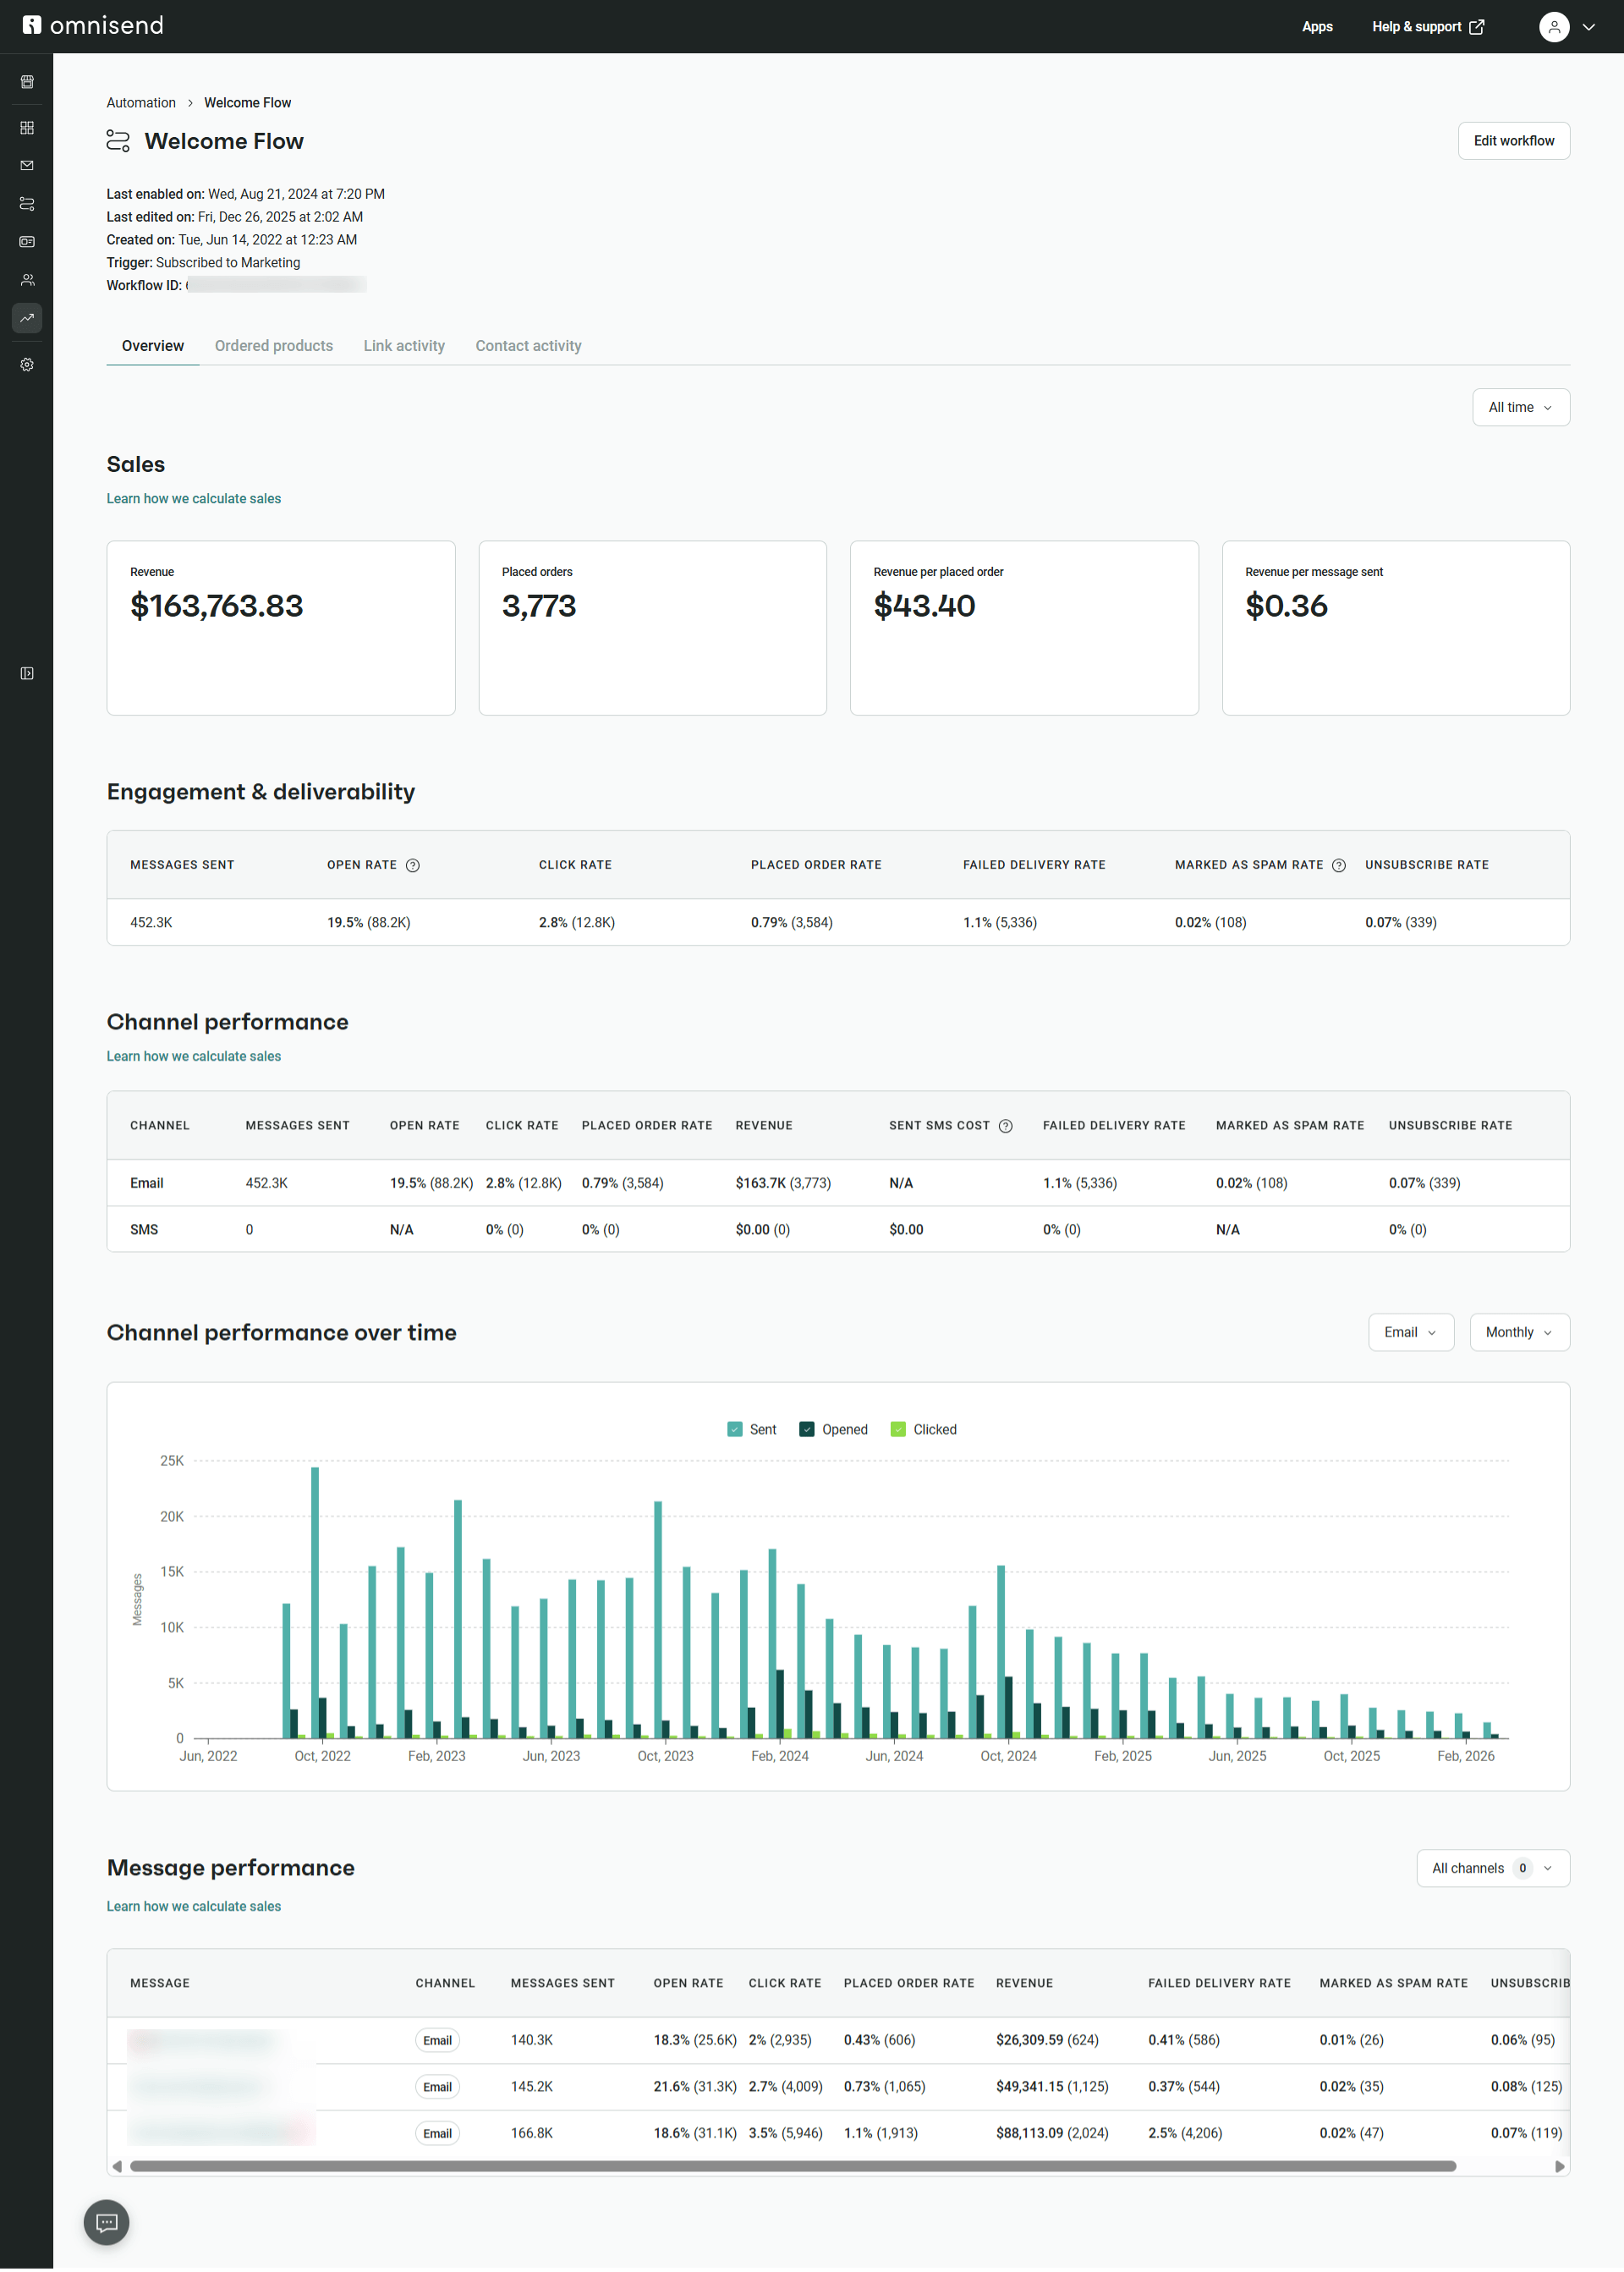
Real-time optimization is easy when you see exactly which message in a series underperforms. Automation reports show the tasks your store does automatically. This includes things like welcome emails for new subscribers or reminders for people who left items in their shopping carts.
These reports include step-level metrics that reveal where users drop off or convert within the journey.
Monitoring these flows helps you know how profitable your customer journey is. It helps you quickly adjust triggers or content to keep conversion rates high without manual work.
The example below is an automated welcome flow series, with highlights showing metrics that reveal how users convert or drop off:
Sales and revenue attribution report example
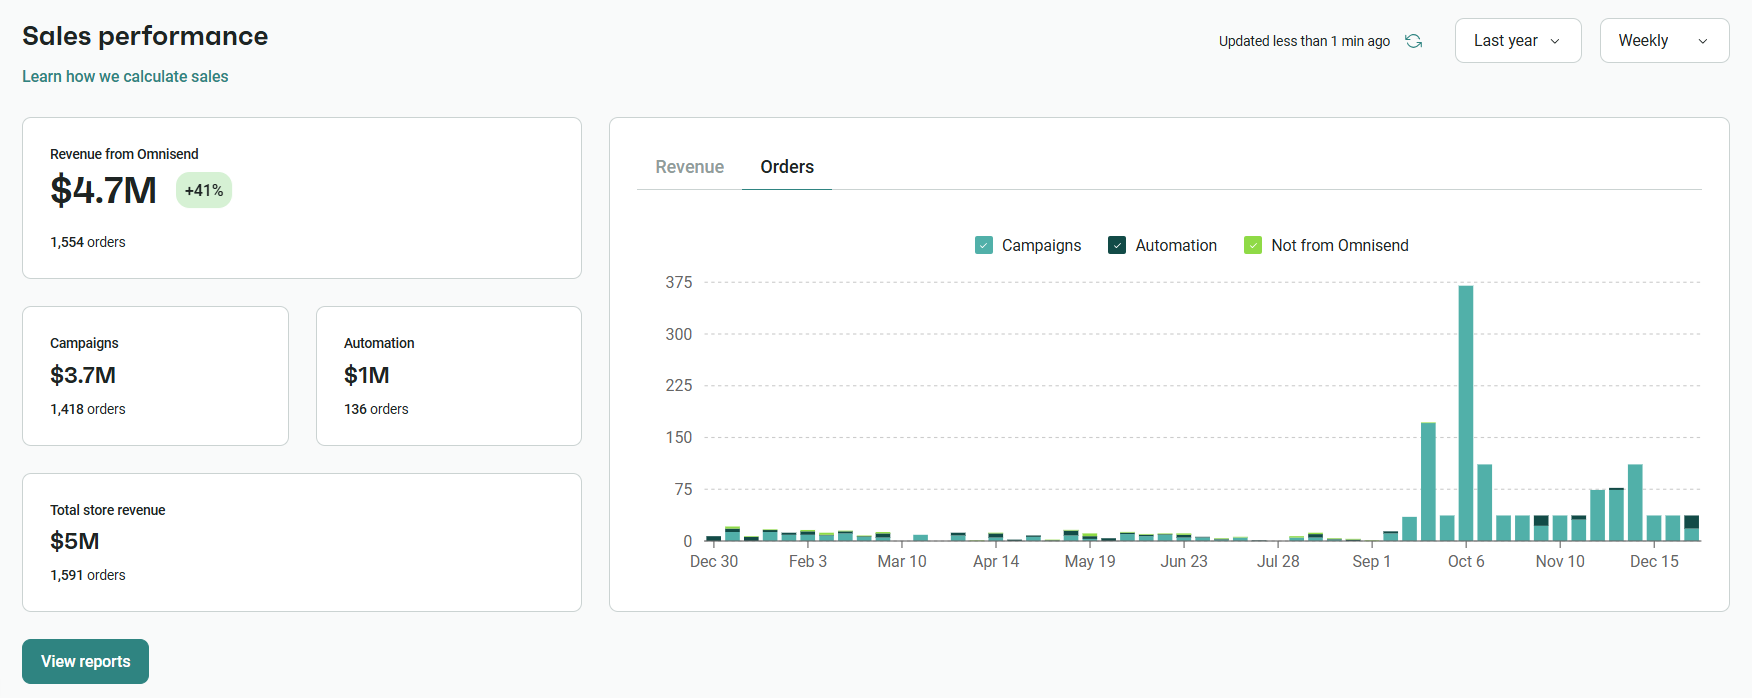
This report shows exactly how much money each campaign or channel generates for your business. Flexible attribution helps you understand the ROI across your marketing campaigns.
Knowing your revenue sources allows for better budget allocation. You can confidently scale the channels that consistently bring in the highest sales volume.
The image below is a sales performance overview. It highlights the revenue split between campaigns and automations:
Audience growth and lifecycle report example
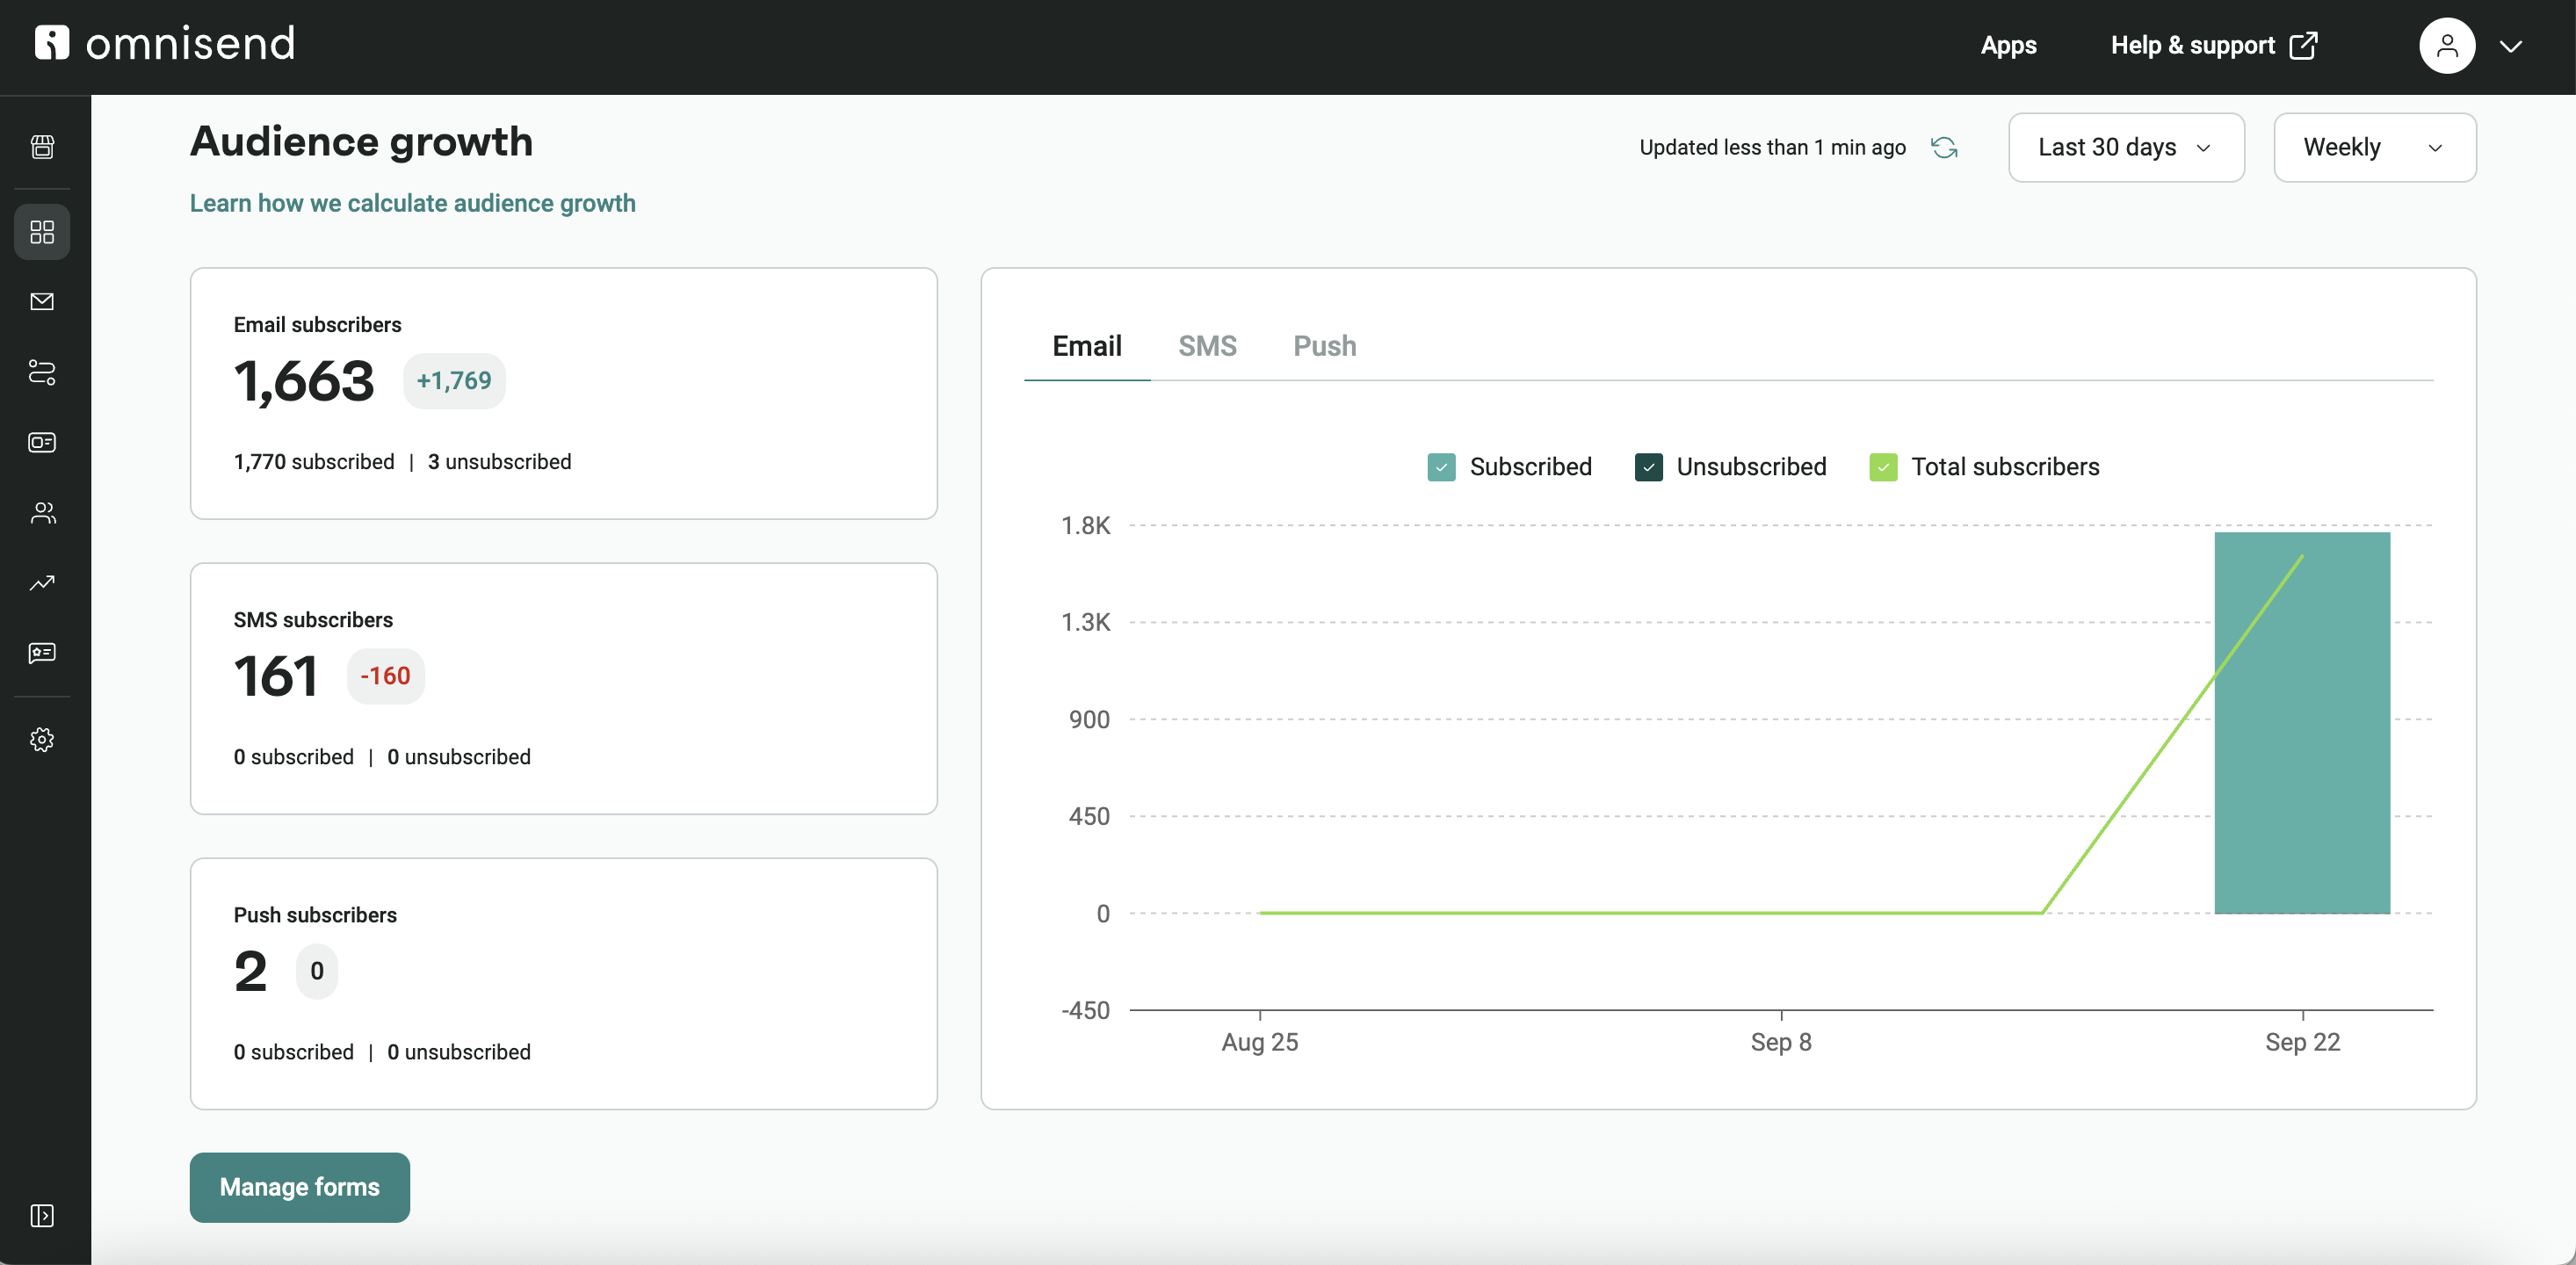
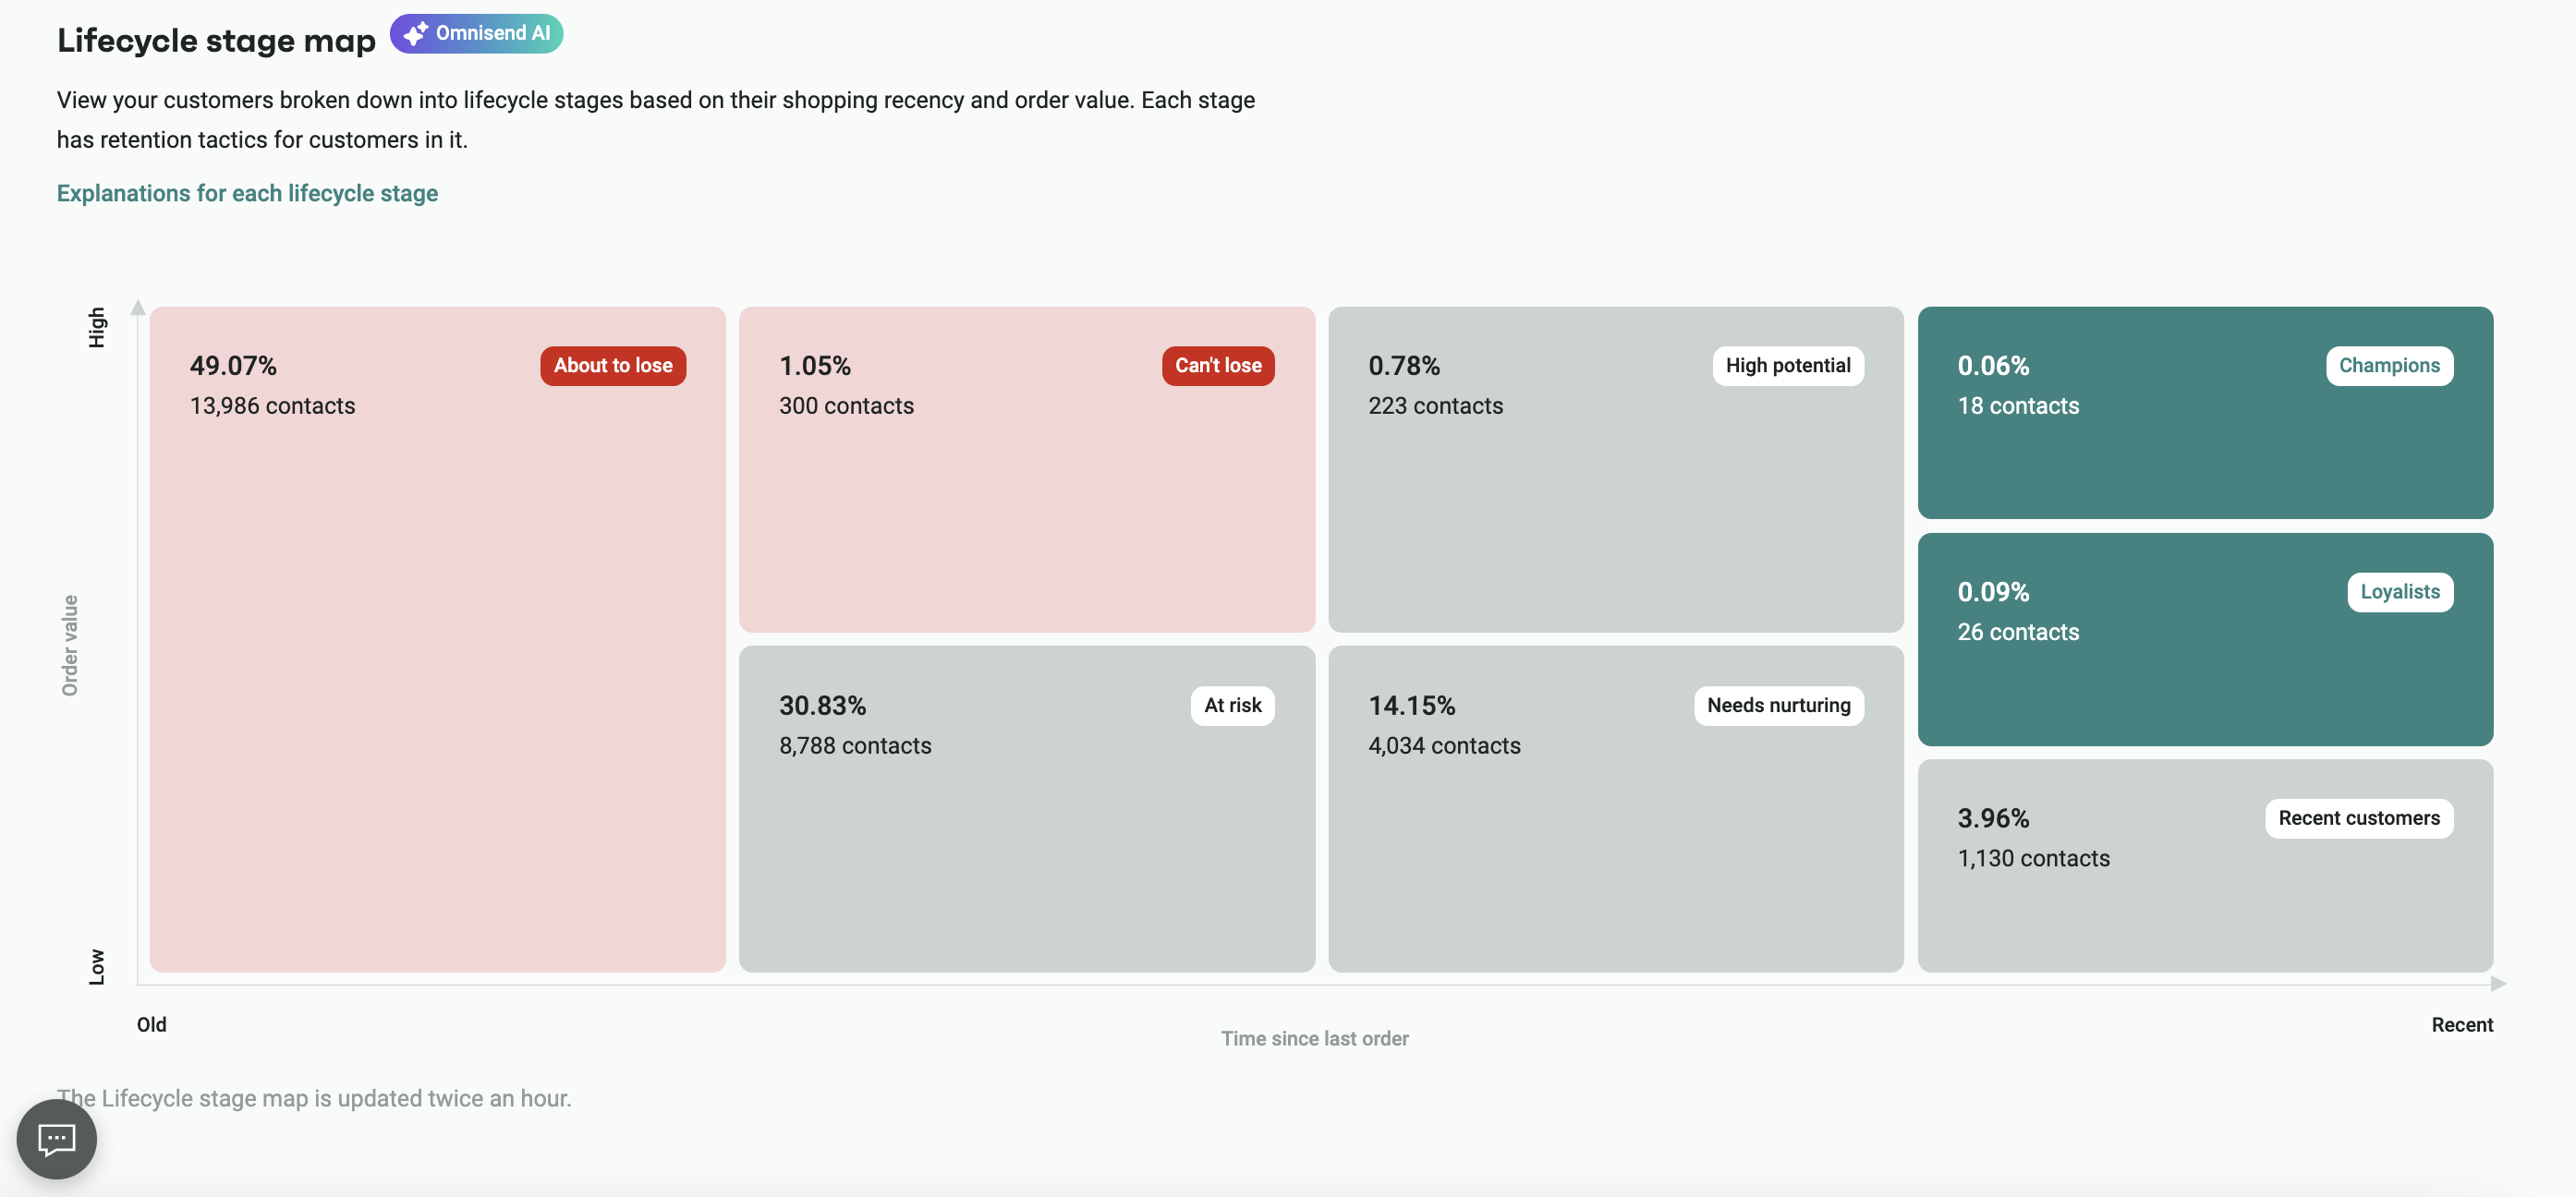
Audience growth and lifecycle reports track changes in your subscriber list. They show new signups, engagement levels, and where subscribers are in their journey.
These reports help you see the different steps people take as they get to know your brand. You can track how they go from just signing up to becoming loyal customers. You can then use this information to better segment your customers. It also helps you make your messages feel more personal and keeps people coming back to your store.
This marketing report example shows audience growth across multiple channels (top). It also displays the lifecycle stage map (bottom):
Delivery and engagement report example
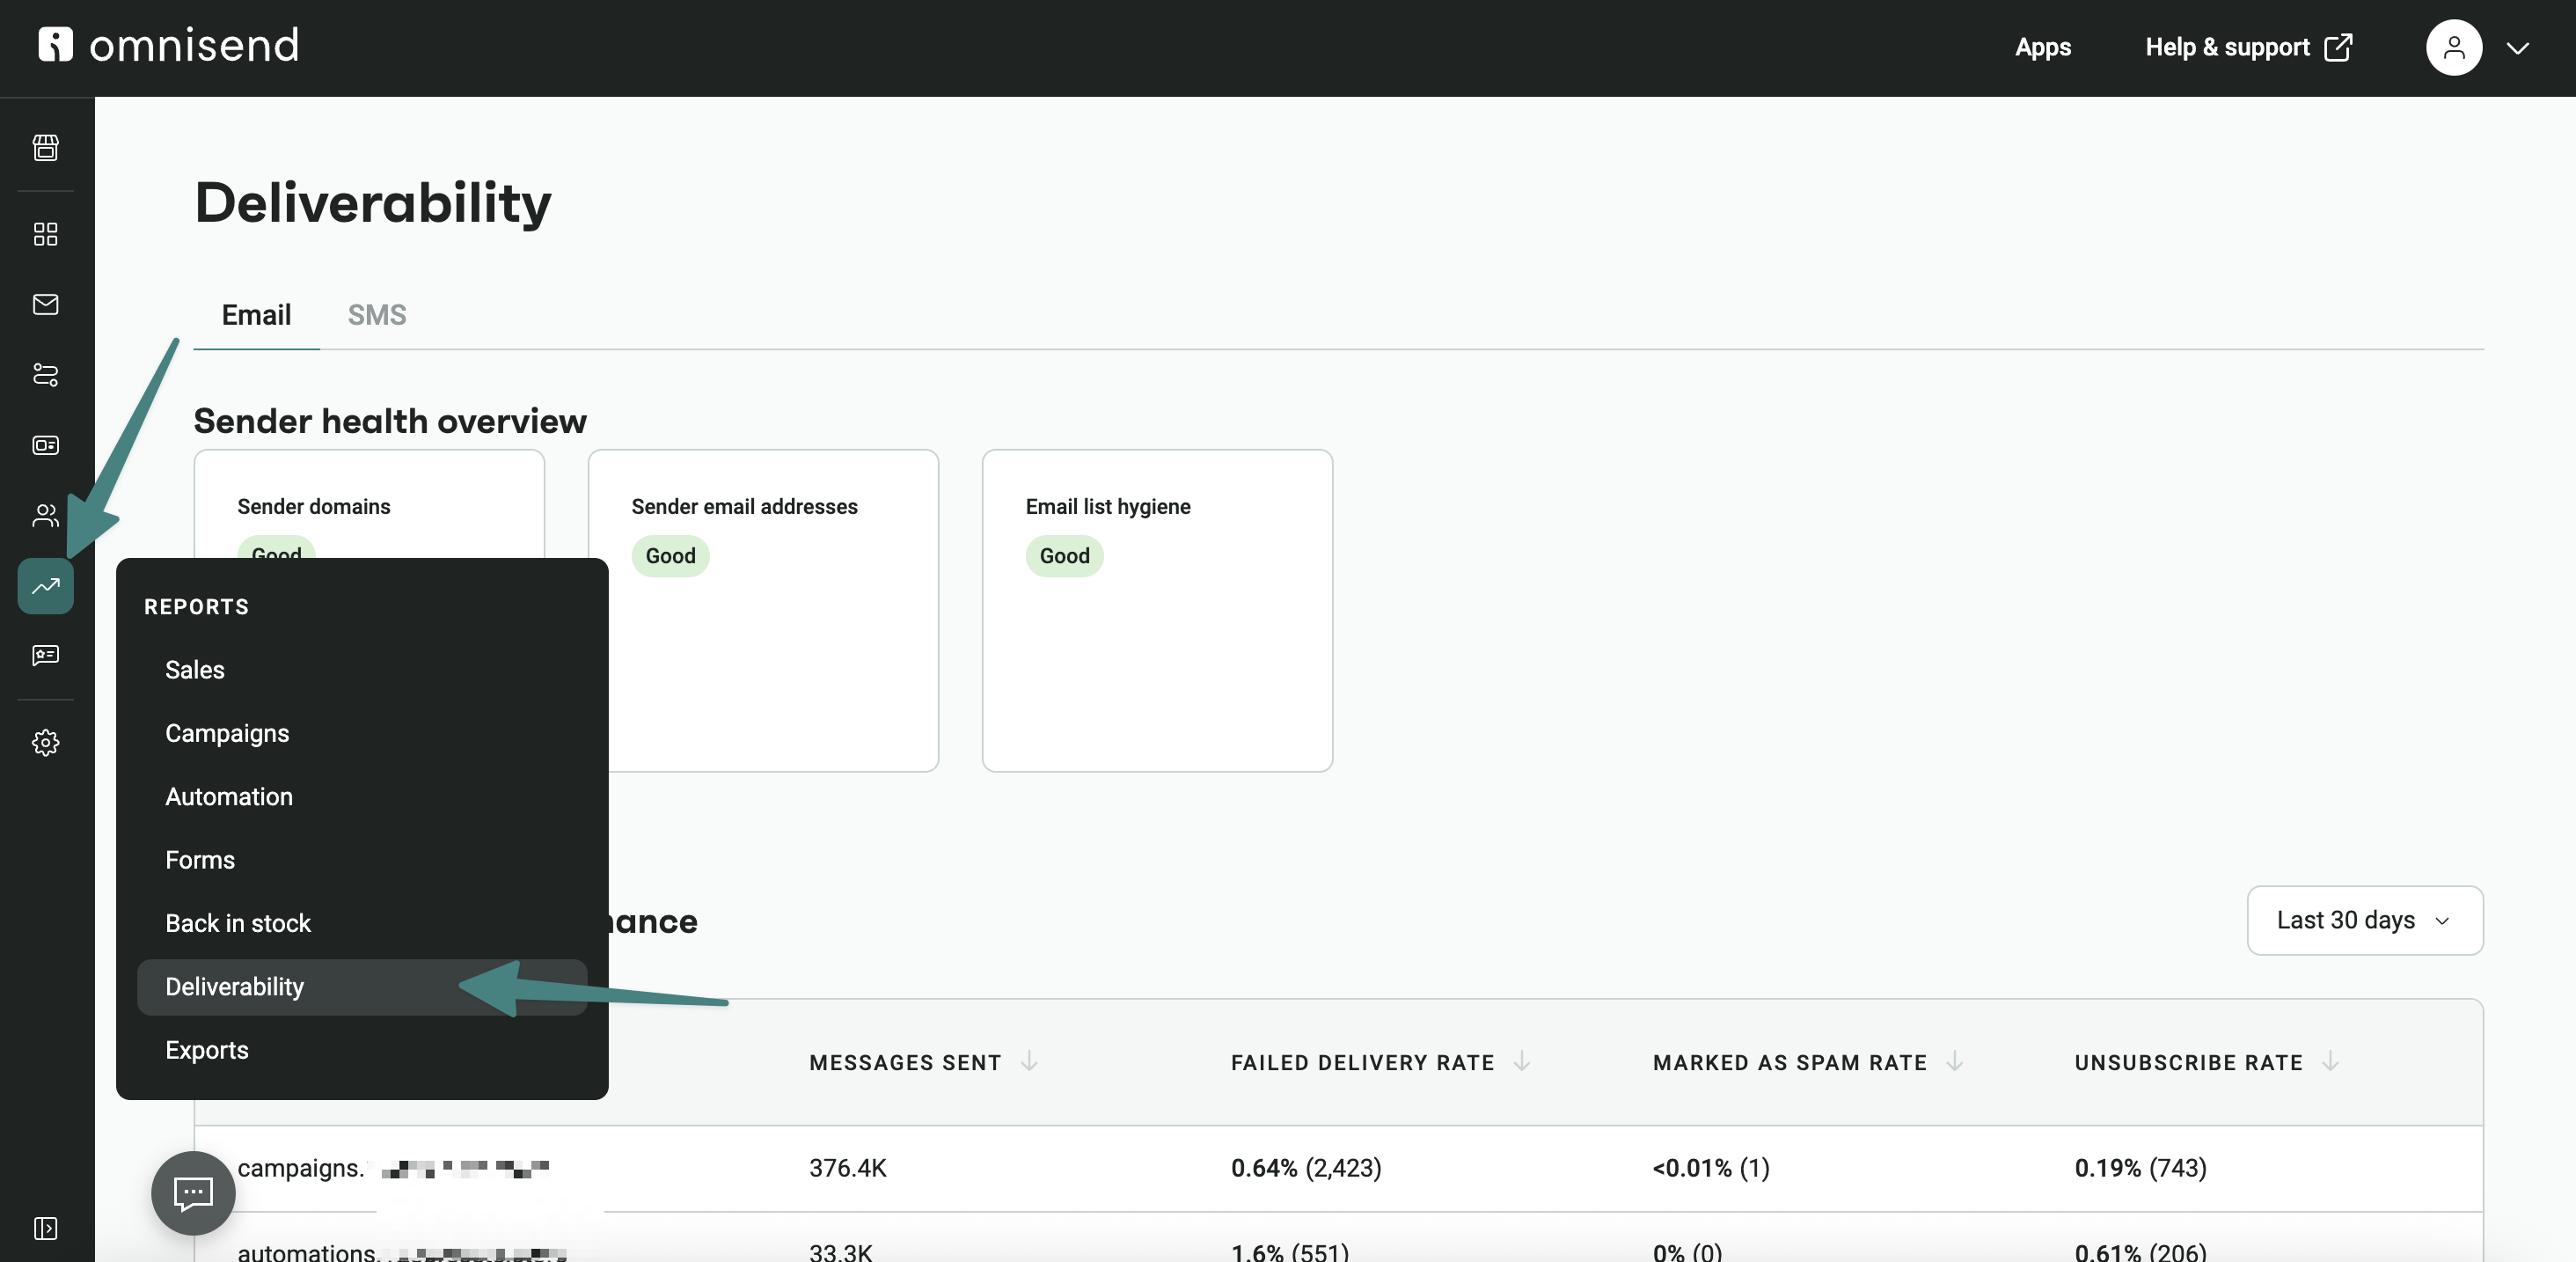
This marketing report focuses on the technical health of your email marketing. It tracks email marketing metrics like bounce rates, unsubscribes, and spam complaint rates.
These insights are essential for ensuring your emails reach the inbox. By monitoring how people react to your emails, you can adjust how often you send them and improve their content.
The delivery report dashboard in Omnisend shows your sender health and how your domain is performing:
Cross-channel performance report example
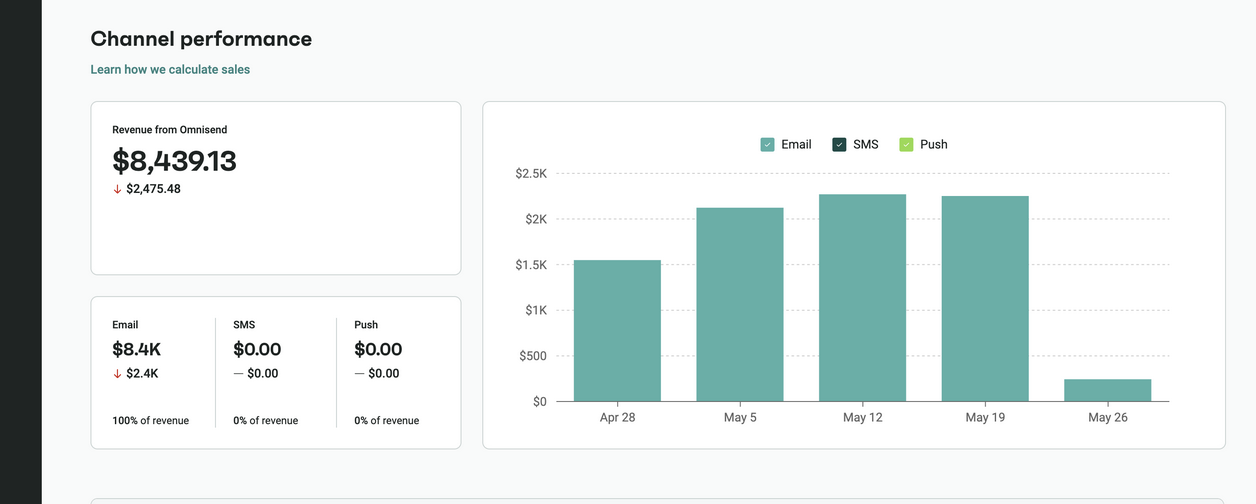
A cross-channel report provides a unified view of your email, SMS, and push notification performance. With this report, you see how different channels work together to drive conversions.
Unified data leads to a more cohesive customer experience and higher overall engagement.
Instead of checking separate tools, you see how all digital channels interact in one place. This unified marketing performance reporting helps you understand the combined reach of your omnichannel marketing strategy.
This example shows how Omnisend displays channel performance across email, SMS, and push notifications:
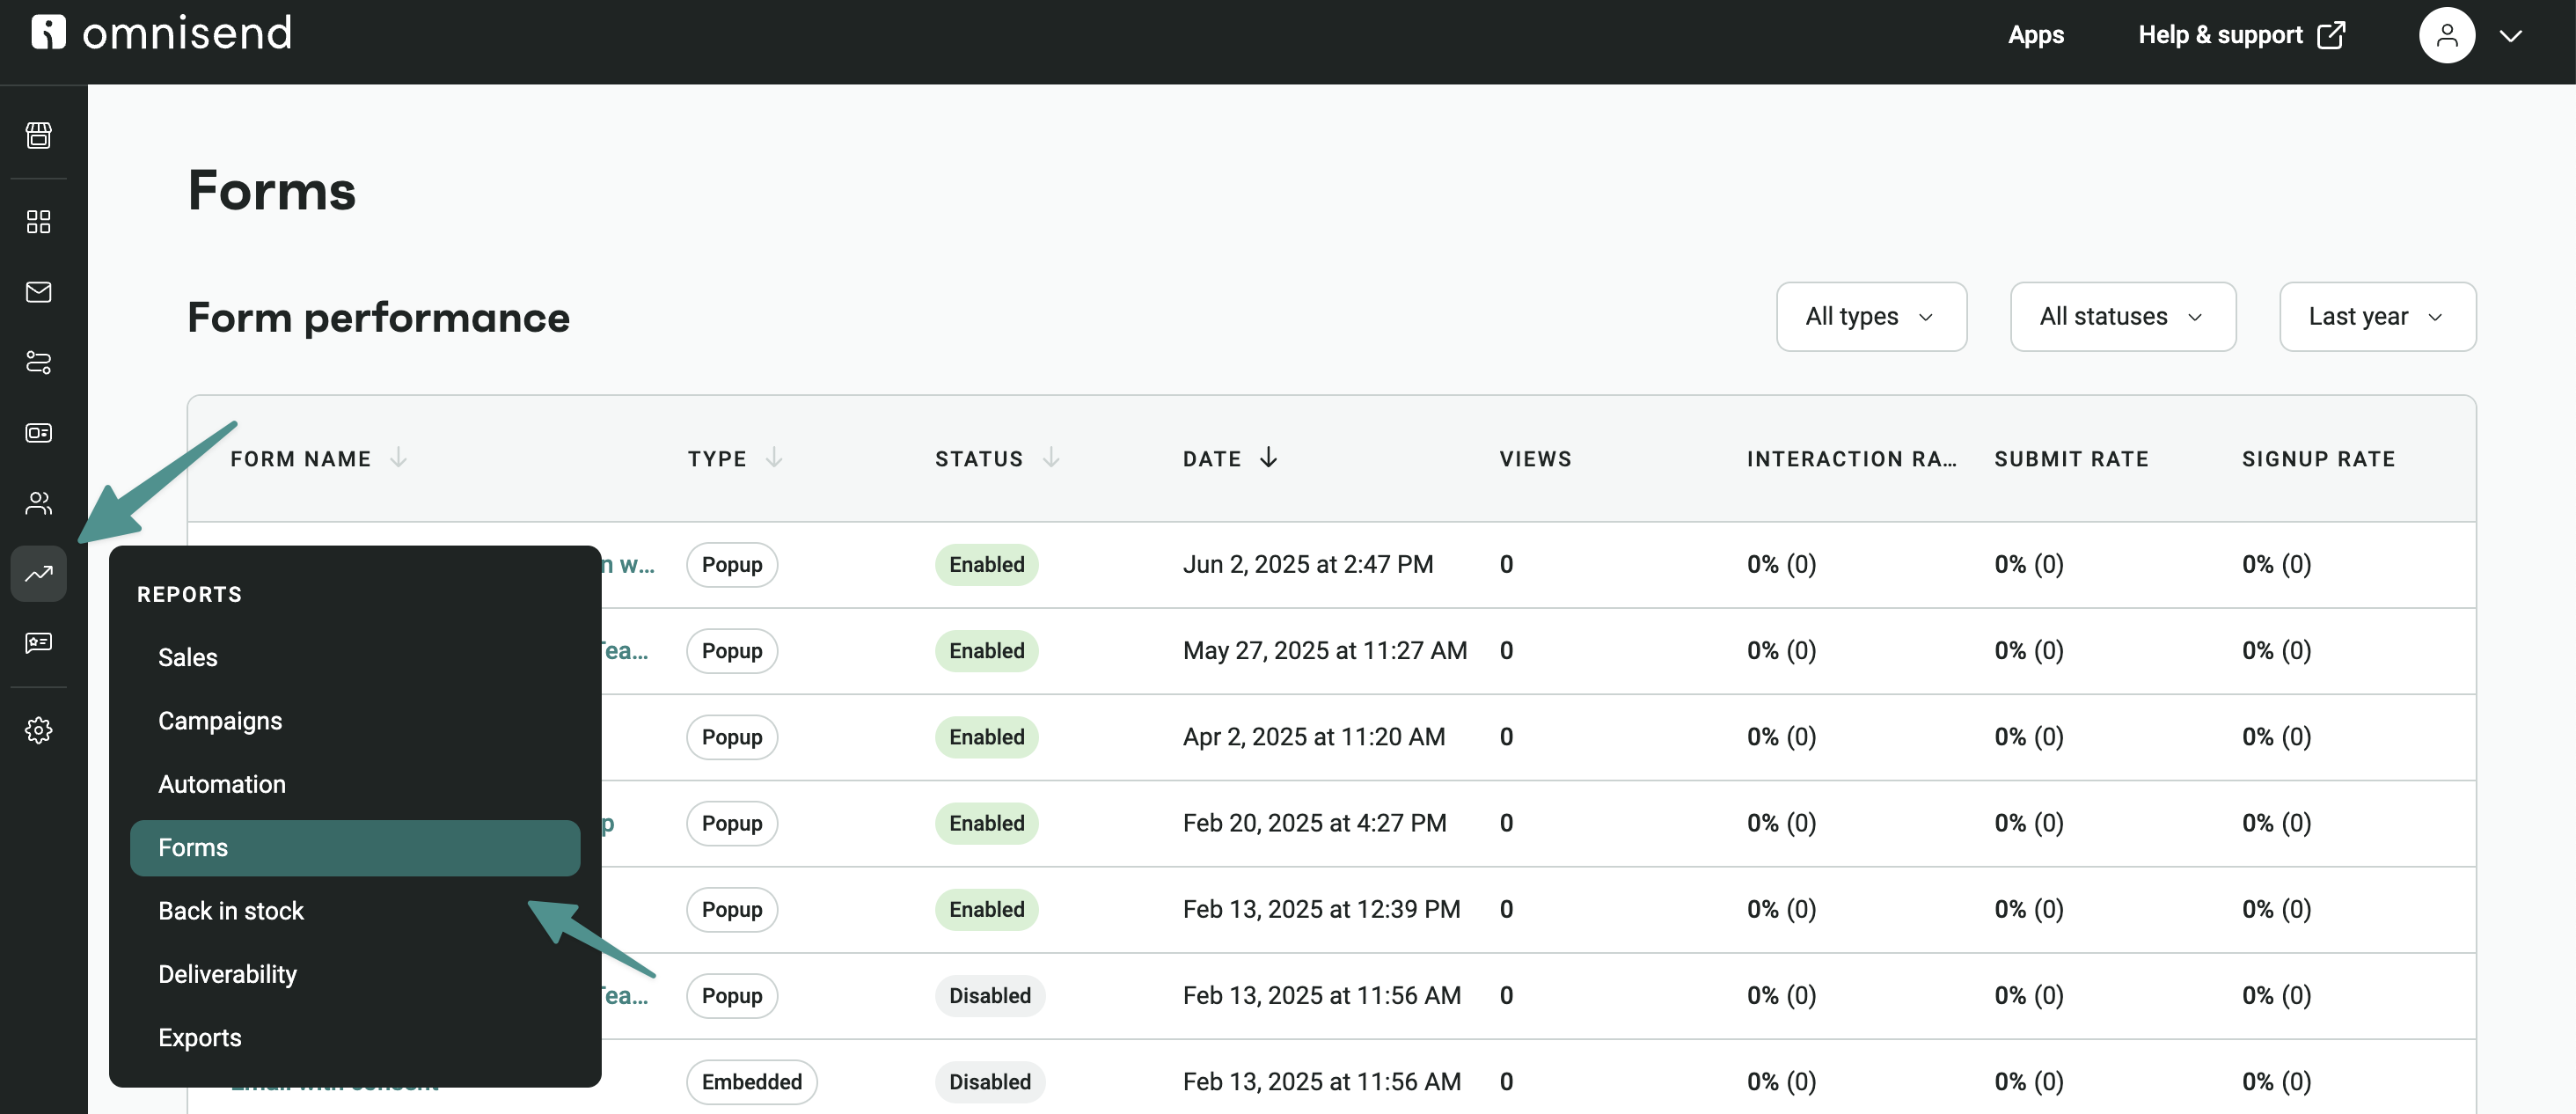
Forms and conversion report example
Forms and conversion reports track how many people sign up and what percentage of visitors actually buy something. They also show you which sign-up boxes and pop-ups have the highest conversion rates.
With this marketing report, you understand which forms perform best and why. With this understanding, you can improve placement, design, and messaging to grow your audience.
The example below shows the form performance dashboard on Omnisend:
How to write a marketing report (step-by-step)
Creating a marketing report is not just about collecting data. It’s about turning that data into insights that support better decisions. A good marketing report should bridge the gap between what happened and what needs to happen next.
To know how to make a marketing report, follow these key steps.
1. Define your goals and KPIs
Start by knowing your marketing objectives. Setting clear goals keeps your report focused and helps you track what actually matters.
Focus on the following KPIs:
- Conversions and revenue
- Click-through rates and engagement
- Customer acquisition cost
- Campaign-specific performance metrics
2. Collect and organize your data
Collect and organize data from all relevant sources to provide a complete view of performance. Use automation tools to collect and organize this data in real time, reducing manual work and improving accuracy.
Common data sources include:
- Email campaigns and automations
- Paid ads and social media platforms
- Website analytics and ecommerce data
3. Analyze results and identify insights
Once your data is ready, focus on what it tells you. Analysis is a critical stage of the reporting process. This is where you move beyond the “what” and look for the “why.”
Your goal is to move beyond numbers and clearly explain what’s working and what needs improvement.
Paying attention to these specific areas will help you create a strategic roadmap:
- Campaigns driving the most revenue
- Where users drop off in the funnel
- Differences between traffic and conversions
- Trends over time
4. Present your findings clearly
The final step is to make your findings accessible to others. Your report should be easy to read and act on. Structure it properly to make key insights stand out.
Focus on clarity over volume. Highlight the key insights to help stakeholders understand the results and take action.
These formatting choices will help your report look visible at a glance:
- Clear headings and short sections
- Charts or tables for key metrics
- Simple summaries of performance
Ready to simplify your marketing reporting?
Automating your marketing reports is the way to go. It helps you make faster, smarter decisions, not slow you down with manual work and scattered data. With the right tools, you can turn complex data into clear insights that guide your strategy.
Omnisend simplifies this process by bringing your email and SMS performance into one place. You can track campaigns, monitor revenue, and understand customer behavior in real time.
With Omnisend’s automated reporting, accurate data, and clear dashboards, you spend less time gathering information and more time improving results.
Track omnichannel marketing report data across email, SMS, and campaigns with Omnisend
Quick sign up | No credit card required
FAQs
What is a marketing report?
A marketing report is a structured summary of campaign performance over a set period. It organizes data into insights that help you track results, measure progress, and make informed decisions.
How do you write a marketing report?
To write a marketing report, follow these steps:
— Define goals and KPIs
— Collect and organize data
— Analyze results and identify insights
— Present your findings clearly
What should be included in a marketing report?
Your marketing reports should include key elements such as:
— Goals and KPIs
— Campaign performance metrics
— Data from relevant channels
— Insights and key findings
— Actionable recommendations
What are the different types of marketing reports?
The different types of marketing reports are:
— Campaign performance reports
— Monthly marketing reports
— Digital marketing reports
— Marketing analysis reports
— Automation performance reports
— Sales and revenue attribution reports
— Audience growth and lifecycle reports
— Deliverability and engagement reports
— Cross-channel performance reports
— Forms and conversion reports
How often should marketing reports be created?
Here is a simple way to approach creating marketing reports based on your reporting needs:
— Use weekly reports to track short-term campaign performance
— Create reports monthly to track overall progress and key metrics
— When analyzing trends for long-term strategy, create quarterly
TABLE OF CONTENTS
TABLE OF CONTENTS

Subscribe and don’t miss any updates!
No fluff, no spam, no corporate filler. Just a friendly letter, twice a month.