
 OFFER
OFFER


Research
Drive sales on autopilot with ecommerce-focused features
See FeaturesKey takeaways 
Understanding key digital marketing statistics empowers ecommerce businesses to craft innovative strategies tailored for 2026, focusing on actionable insights rather than generic benchmarks.
Email and SMS marketing are proven to deliver the highest ROI, with email generating $36 to $79 for every dollar spent, significantly outperforming paid advertising channels.
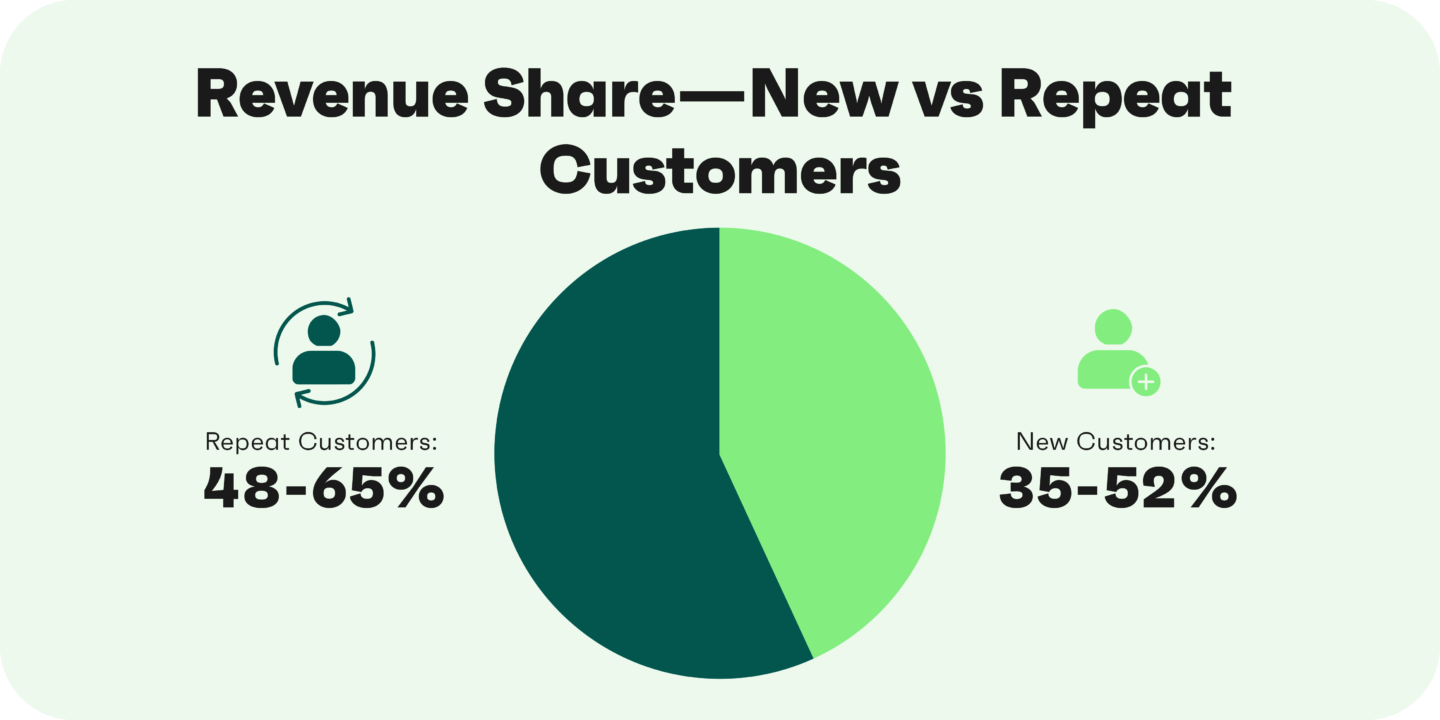
Prioritize building owned channels like email and SMS for customer retention, as repeat customers account for 44% of total revenue while representing only 21% of the customer base.
Regularly benchmark your performance against industry standards and adjust your budget allocation to maximize ROI, ensuring at least 40-50% of your marketing budget is dedicated to high-performing channels like email and SMS.
Reveal key takeaways
Knowing key digital marketing statistics enables ecommerce businesses to plan more innovative strategies for 2026.
Most stats combine B2B, SaaS, and B2C data. This makes it hard to determine which ones apply to your online store.
In this article, we’ve compiled and focused on ecommerce digital marketing statistics that matter to retailers like you.
You’ll find benchmarks for email, SMS, automation, paid advertising, social media, SEO, and more. We’ve also included proprietary data from Omnisend, which are actual performance numbers from thousands of ecommerce stores.
Beyond just numbers, you’ll learn how to interpret these online marketing statistics based on your store size. You’ll also discover how to compare your performance against industry averages and allocate your budget for maximum ROI.
Implement these benchmarks with Omnisend’s email and SMS automation features
Quick sign up | No credit card required
How to use these digital marketing statistics for ecommerce
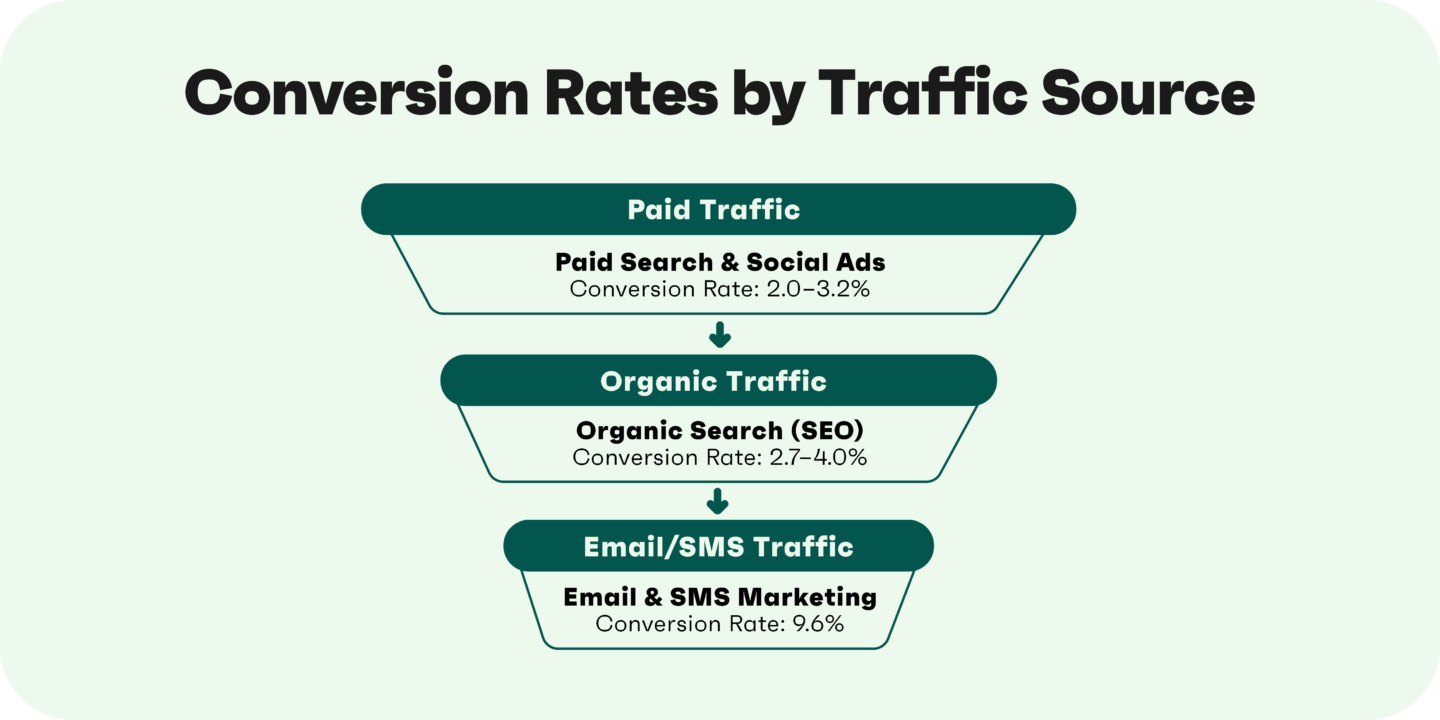
Digital marketing statistics only matter when you know how to interpret the data and apply it. Looking at benchmarks without context won’t help you grow your store. You need to create an actionable framework to convert these figures into a strategy that improves your ROI.
The difference between raw data and actionable insights hinges on interpretation and analysis. For instance, a two percent conversion rate might be great for luxury furniture but not for beauty products.
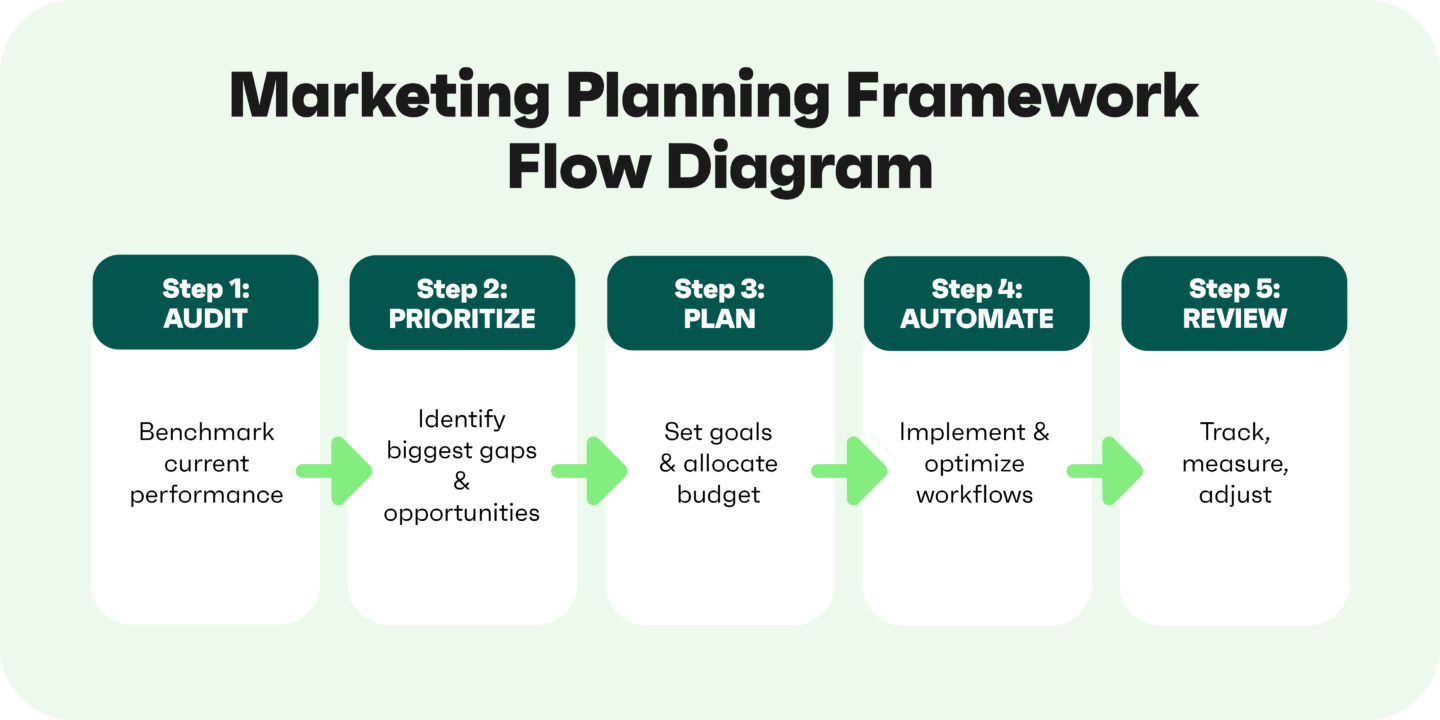
You can’t simply compare your numbers to generic benchmarks and consider it a done deal. Here’s a simple process for leveraging the digital marketing stats in this article:
Step 1: Benchmark your current performance
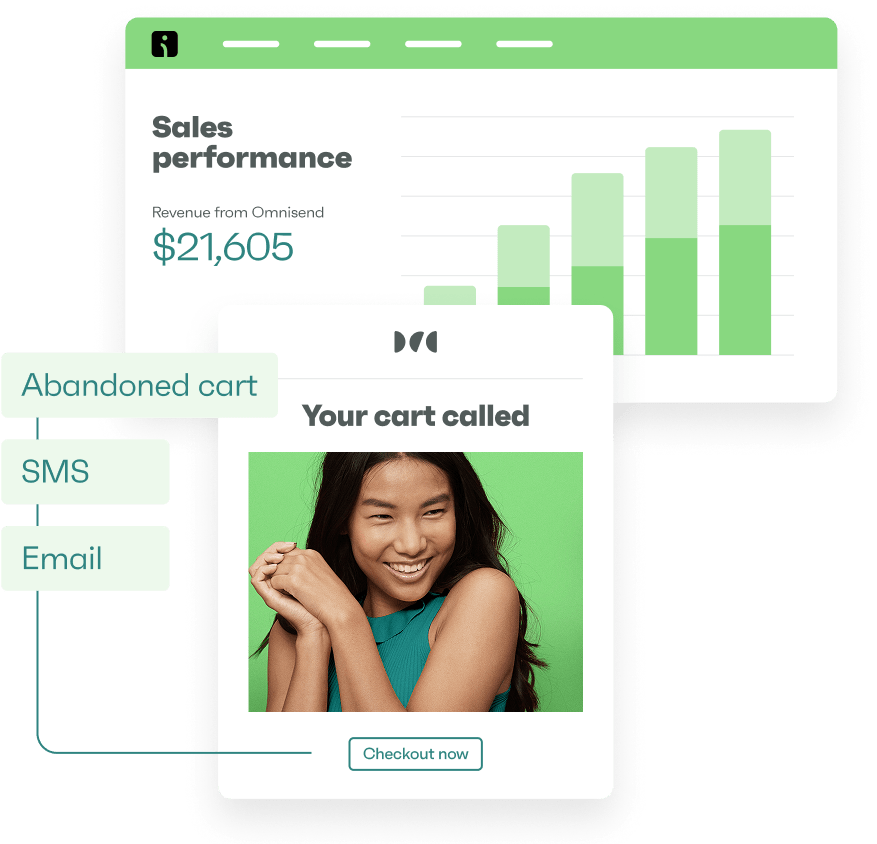
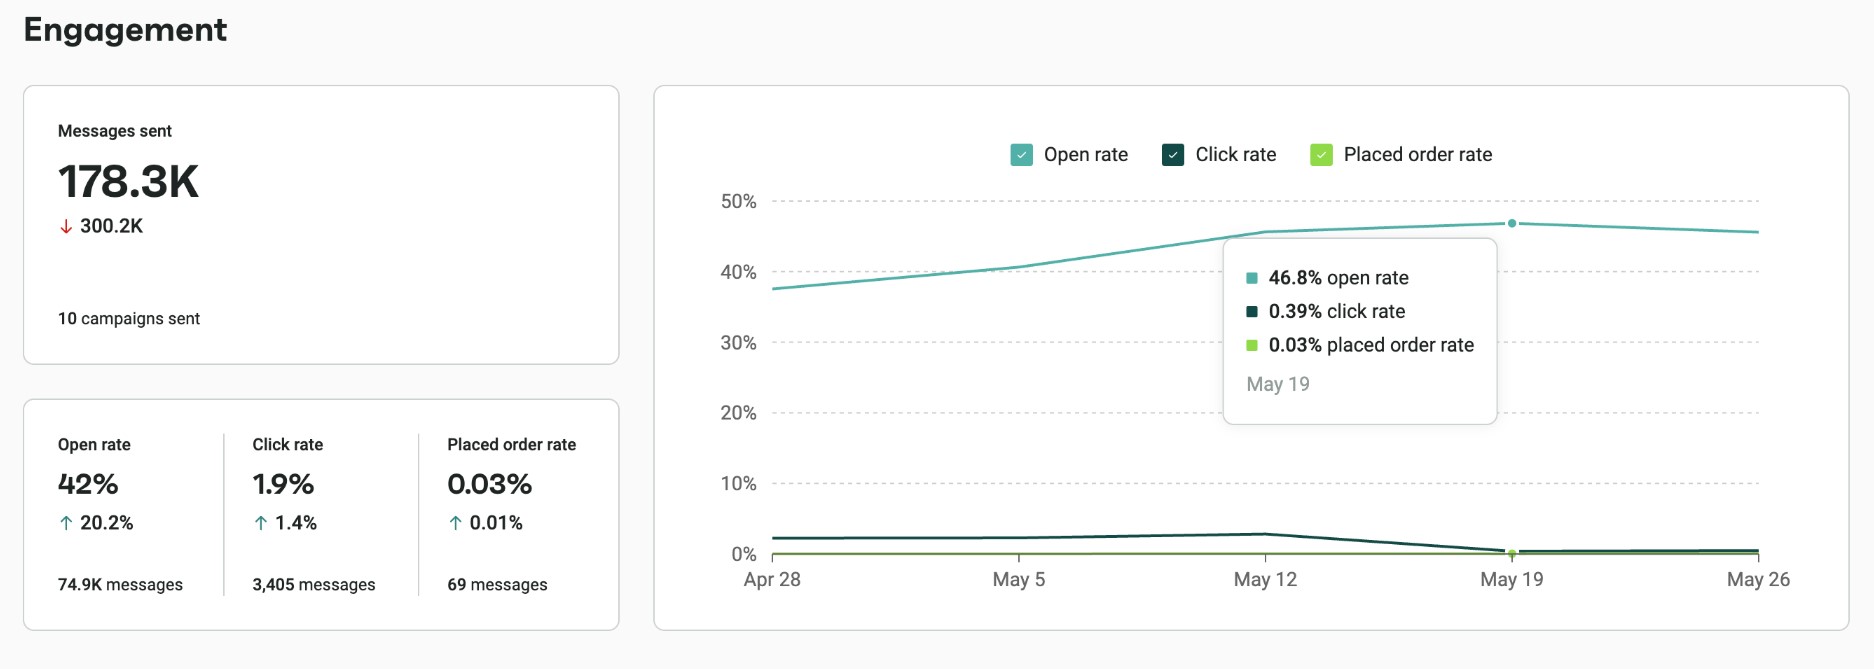
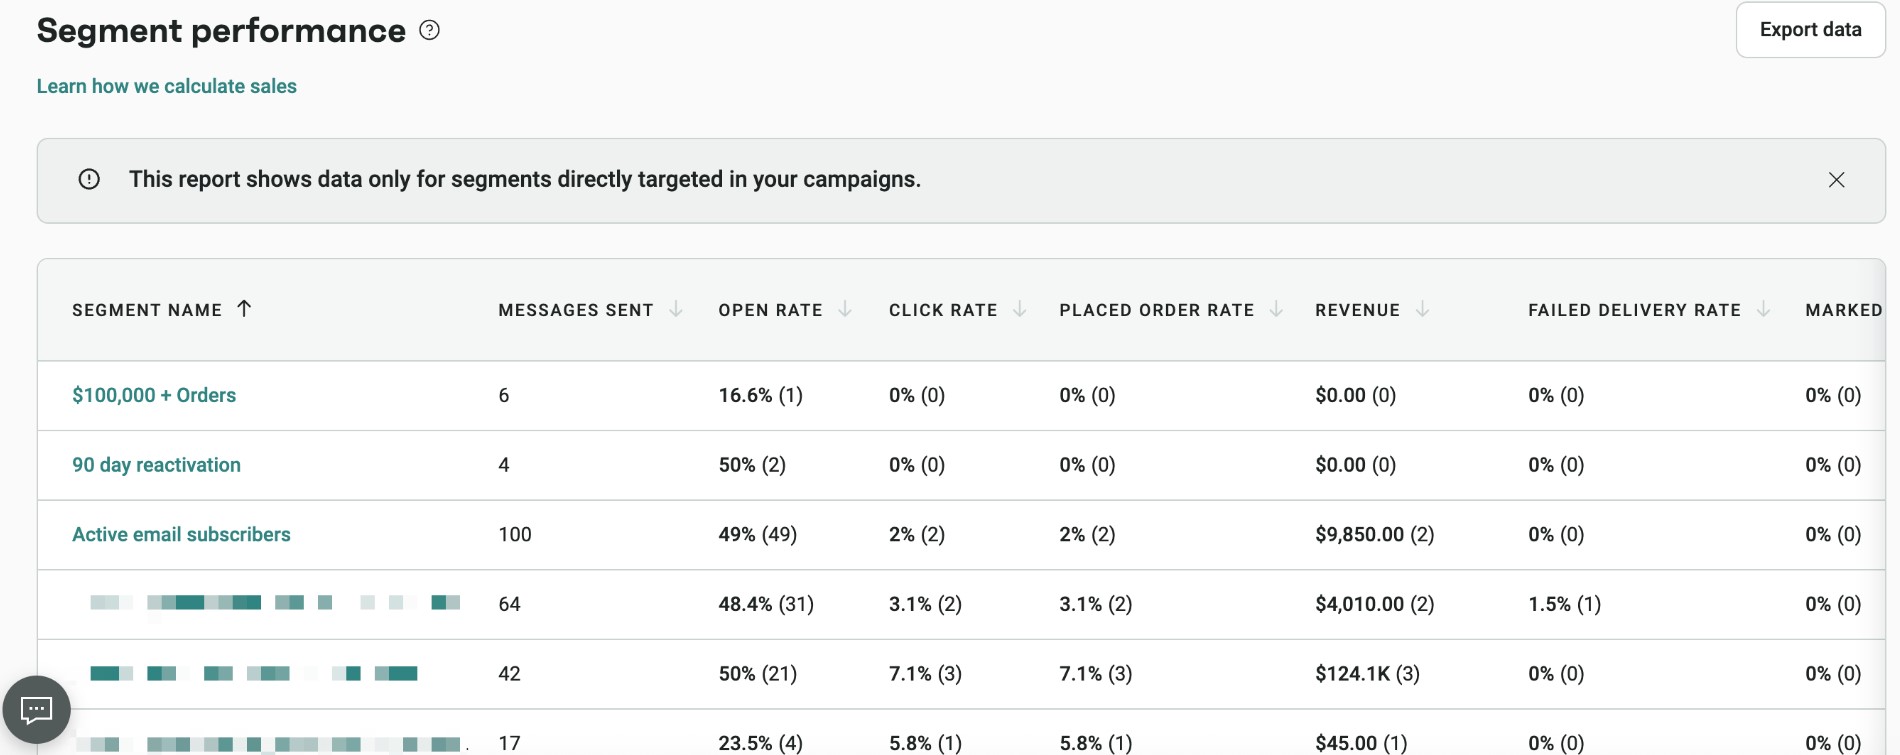
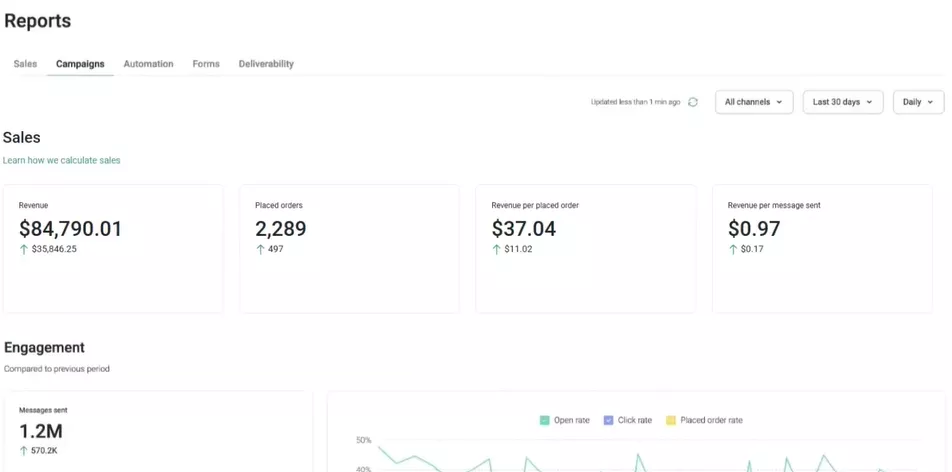
Gather data for key metrics like email open rates, click rates, conversion rates, customer acquisition cost, and revenue per customer. Write them down. You need to know where you stand before you can improve. Tools like Omnisend provide intuitive dashboards like this:
Step 2: Identify gaps versus industry averages
Compare your metrics to the ecommerce-specific benchmarks in this article. Look for the most significant gaps. Perhaps your email open rates are strong, but your conversion rates are lagging. Perhaps your CAC from paid ads is eating into your margins, while email delivers a strong ROI.
Step 3: Prioritize high-ROI channels
Email, SMS, and automation provide some of the most consistent and highest returns for ecommerce brands. If you’re focusing most of your budget on paid ads while neglecting these owned channels, you’re not maximizing your earning potential.
Use the statistics in this guide to rebalance your channel mix.
Step 4: Adjust your budget and tactics
Once you know where you’re underperforming and which channels offer the best ROI, shift resources accordingly. Add the marketing automation features you might be missing.
Test your SMS if you haven’t already, and optimize your email strategy before investing more in paid acquisition.
How you interpret benchmarks will depend on the size of your store and annual revenue:
- Small stores under $500K should focus on building foundational channels like email and basic automations
- Mid-market stores between $500K and $5M need sophisticated segmentation and omnichannel workflows
- Larger brands above $5M should use advanced personalization and lifecycle marketing to maximize customer lifetime value
Owned channels, such as email and SMS, are your foundation. Paid advertising helps you scale, but pricing can be unpredictable. Build a strong base of owned channels first, then utilize paid ads to further develop your strategies.
Pro tip:
Omnisend’s reporting dashboard lets you track these metrics in one place.
You can monitor email performance, SMS results, automation revenue, and campaign ROI all in one place, without needing to switch between tools. This makes it easier to spot trends and act on opportunities quickly.
Key ecommerce-wide digital marketing benchmarks for 2026
Before breaking down channel-specific performance, it is essential to understand the big picture. These digital marketing statistics show how various ecommerce channels perform and where you can focus your marketing efforts.
Marketing ROI and revenue performance:
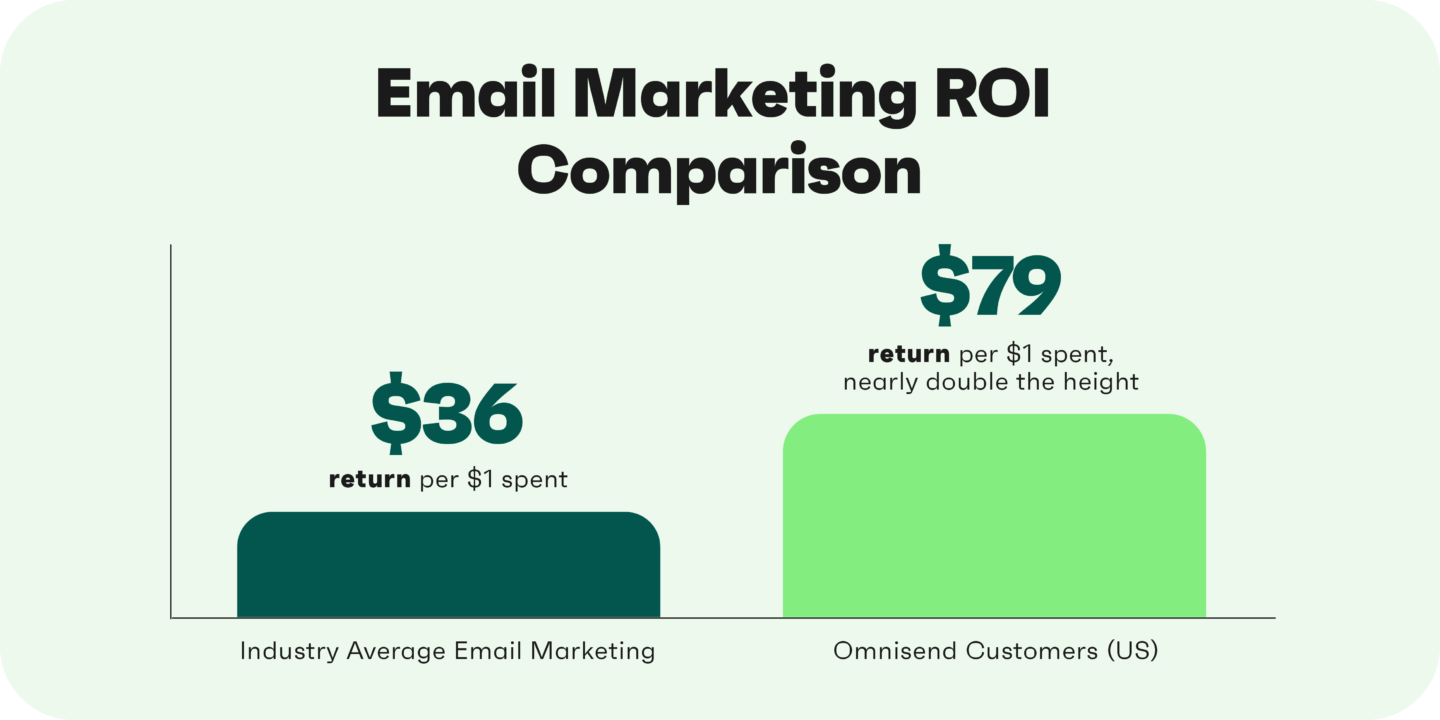
- Omnisend customers see $79 for every dollar spent when using email
- Email marketing delivers $36 to $40 for every dollar spent across ecommerce businesses
- Paid advertising typically returns $2.5 for every dollar spent on ecommerce campaigns
- Google provides an 8:1 ROI or $8 for every dollar spent on search advertising
| Channel | Average ROI |
|---|---|
| $36–$40 per dollar spent | |
| SMS | $21–$71 per dollar spent |
| Paid ads | $2.5 per dollar spent |
| SEO (organic search) | $7.48 per dollar spent |
Customer acquisition costs across channels:
- The average ecommerce CAC sits around $45 to $175 globally, but this varies based on factors like region and industry
- CAC has increased approximately 40% between 2023 and 2025 for ecommerce brands
- Email and organic marketing channels have lower acquisition costs than paid channels
Revenue composition and customer value:
- The average repeat customer rate across ecommerce is 28.2%
- After a first purchase, customers are 27% likely to buy again — it jumps to 49% after the second purchase and 62% after a third
Marketing budget benchmarks:
- Marketing budgets remained flat at 7.7% of company revenue in 2025
- Ecommerce businesses allocate up to 7% to 12% of total revenue toward marketing, with newer brands investing up to 20%
- Paid media accounts for 30.6% of marketing budgets or 2.4% of company revenue
Channel ROI by business type:
- For B2C brands, email marketing delivers the highest ROI, followed by paid social media content and content marketing
- For B2B brands, website/blog/SEO delivers top ROI, followed by paid social and social shopping tools
How to read these benchmarks
These numbers give you a baseline. They aren’t a target you must hit exactly. Your performance depends on your industry, average order value, product type, and customer lifecycle.
A store selling mattresses priced at $2,000 should monitor different metrics than one selling $25 supplements.
If your email ROI falls below $36 per dollar spent, then adjustments are necessary. If your CAC from paid channels exceeds 30% of your average order value, you need to strengthen your owned channels.
The gap between the amount you spend to acquire customers and the revenue you gain from those customers determines your profitability.
What this means for your store
Owned channels like email deliver dramatically better ROI than paid advertising. CAC from paid channels has increased 40% in just two years. This makes customer acquisition more expensive.
Meanwhile, repeat customers bring in more revenue, even though they are a small portion of your customer base.
This points to an often-missed opportunity. Build stronger email and SMS programs to reduce reliance on paid channels. Then, focus on retention to maximize the value of every customer you acquire.
Email marketing statistics for ecommerce
While other channels come and go, email remains the cornerstone of ecommerce marketing. It continues to deliver impressive results, including notable ROI and customer engagement.
Let’s examine digital marketing statistics related to email.
Email ROI and revenue benchmarks for ecommerce
Email marketing is one of the most cost-effective channels for driving revenue for ecommerce stores. Read these digital marketing statistics to understand why:
- Omnisend customers get $79 back for every dollar spent on email marketing, showing one of the highest ROIs in ecommerce marketing
- Email campaign click-to-conversion rates grew by 27.6% in 2024, indicating that consumers who engage with emails are more likely to convert
- One in three people who click on an automated email make a purchase, compared to just one in 18 for scheduled campaign messages
- Overall, email marketing delivers $36 to $40 for every dollar spent, translating to a 3,600% to 4,000% ROI
What this means for your store
Email yields a higher average ROI than paid advertising channels. This means it’s your most cost-effective tool for driving revenue. Its rising click-to-conversion rates indicate that shoppers are increasingly relying on email to inform their purchase decisions.
Engagement benchmarks: Opens, clicks, and conversions
Current digital marketing statistics reveal performance gaps between automated and manual campaigns. They help you identify optimization opportunities.
- Email open rates reached 26.6% in 2024, marking the fourth consecutive year of growth with a 6% year-over-year increase
- The click rate for campaign emails lowered to 1.22% in 2024, but click-to-conversion rates improved by 27.6%
- Ecommerce email campaigns had an average of 0.07% conversion rate, with top-performing industries like games (0.30%), autos and vehicles (0.23%), and arts and entertainment (0.18%) significantly exceeding this benchmark
- The UK led global markets with a 14.37% click-to-conversion rate, followed by Lithuania at 9.07% and Germany at 7.37%
What this means for your store
Rising open rates indicate that email remains one of the most effective ways to capture customer attention. If your metrics fall below these benchmarks, focus on optimizing the subject line, segmenting your lists, and testing send times to close the gap.
Automation workflows vs. one-off campaigns
Digital marketing statistics show that automated emails outperform manual campaigns across most marketing metrics:
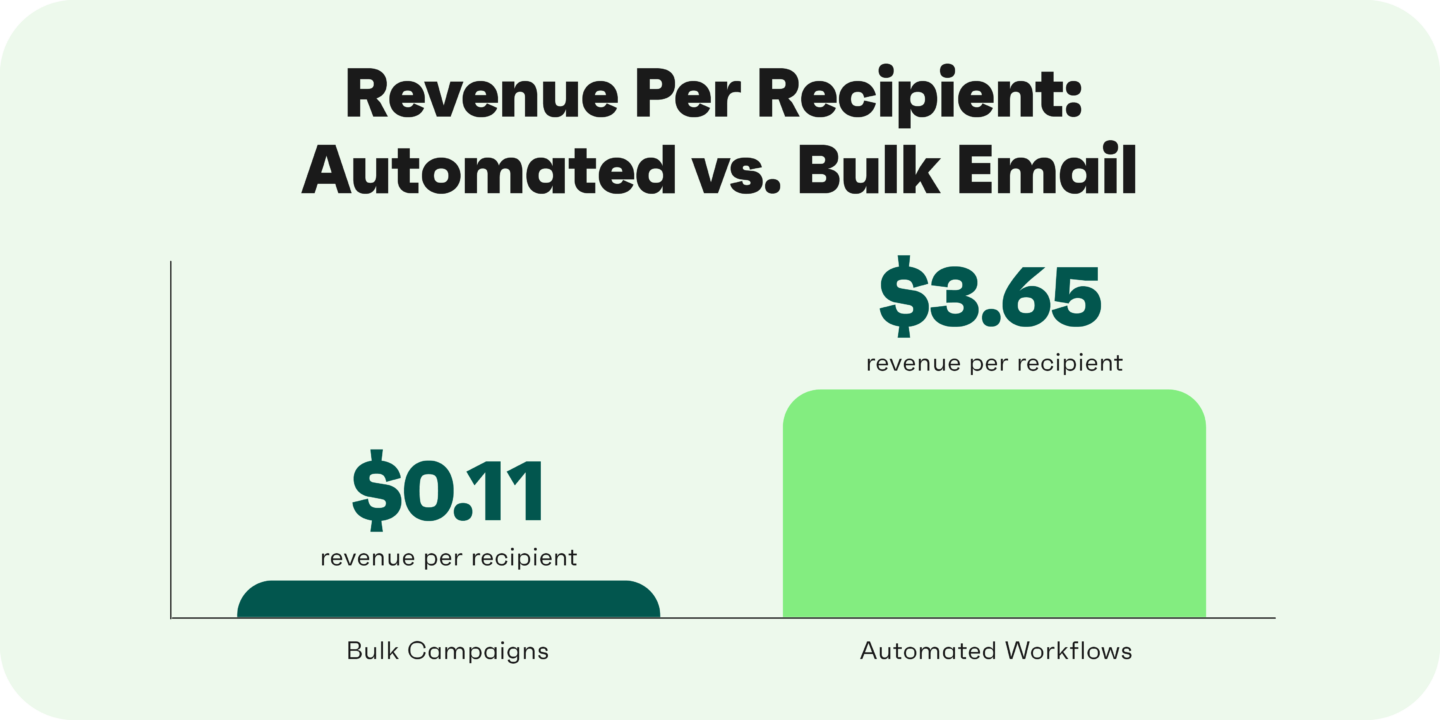
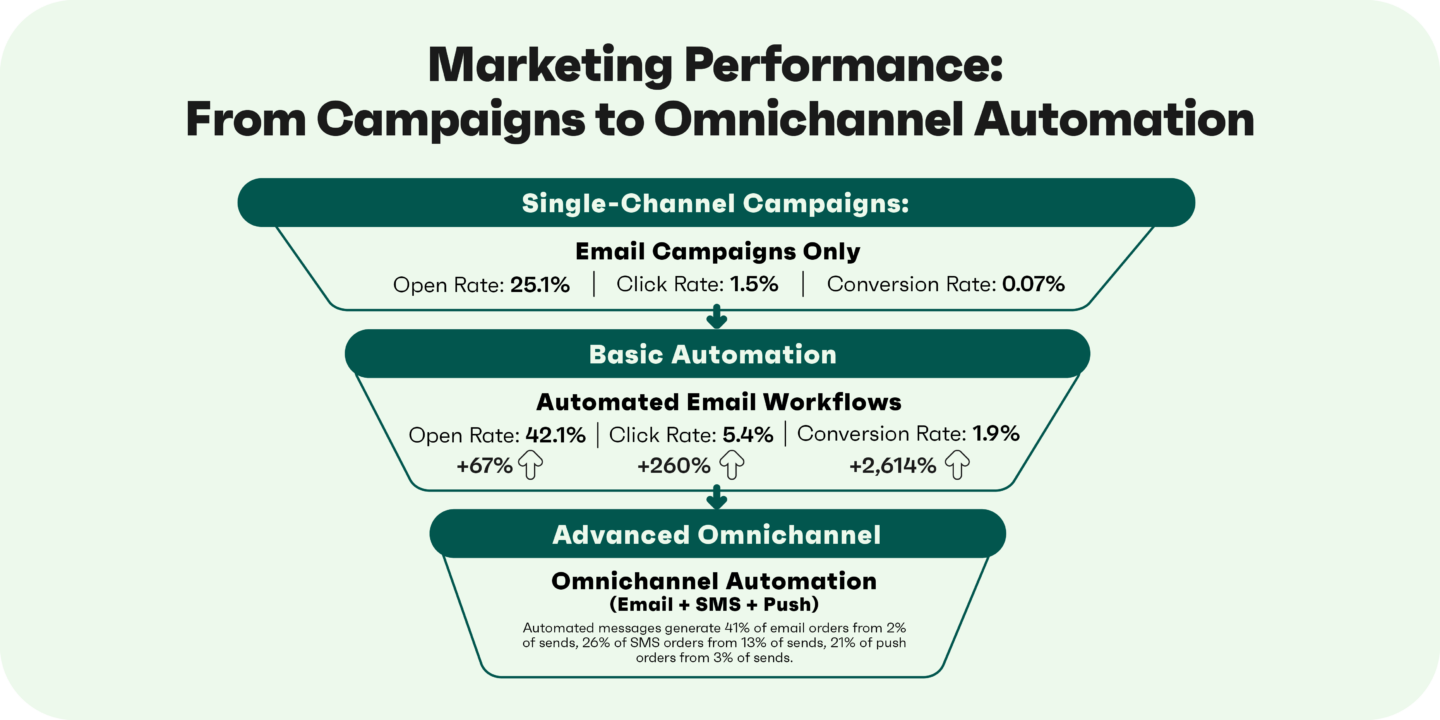
- Automated emails drove 37% of all email-generated sales in 2024, despite making up just 2% of email volume
- Automated emails achieved a 42.1% open rate, 5.4% click rate, and 1.9% conversion rate, which are significantly higher than regular campaigns
- One in two people who click on automated welcome or abandoned cart emails make a purchase
- Abandoned cart, welcome, and browse abandonment emails accounted for 87% of all automated orders, making these three workflows essential for any ecommerce store
- Back-in-stock emails achieved a 59.19% open rate and 5.34% conversion rate, leveraging customer testimonials and limited items to drive purchases
What this means for your store
Automated workflows are essential, not optional. Without them, you could miss out on significant revenue and fail to optimize every customer touchpoint.
Start with the big three (abandoned cart, welcome, and browse abandonment). Then, expand to back-in-stock, post-purchase, and re-engagement flows. You can use tools like Omnisend to present a detailed breakdown of these metrics in reporting dashboards:
Segmentation, personalization, and list growth statistics
Digital marketing statistics consistently show that personalized, segmented emails outperform one-size-fits-all approaches:
- Subject line personalization increases open rates by 10% to 14% across industries, making it one of the simplest ways to improve performance
- Behavioral triggers generate 10 times more revenue than regular marketing emails, as they reach customers when they’re most likely to convert
- 90% of email marketers report that subscriber segmentation increases performance
- 80% of consumers are more likely to purchase from brands that offer personalized experiences throughout their communications and shopping journey
What this means for your store
Personalization requires more than inserting first names in subject lines. Segment your list based on purchase history, browsing behavior, engagement levels, and lifecycle stage. Deliver messages that resonate with each customer’s specific needs and interests.
SMS marketing statistics for ecommerce
SMS delivers measurable revenue for ecommerce. These digital marketing statistics indicate that while email remains the foundation, SMS is effective for instant delivery and high engagement rates, which directly translate to sales.
Core SMS performance benchmarks for online stores
SMS delivers strong engagement and conversion metrics for ecommerce. These digital marketing statistics demonstrate why SMS is essential:
- US brands generated over $25 million in SMS sales in 2024 alone, proving SMS’s direct impact on revenue
- SMS campaigns achieved a 7.6% click rate and 0.13% conversion rate, while automated SMS reached 9.4% clicks and 0.28% conversions
- Most businesses report SMS click-through rates between 21% and 35%, significantly outperforming email’s typical one to three percent range
- 82% of consumers check their text notifications within five minutes of receiving them, with 32% checking within just 60 seconds
- 84% of consumers opted in to receive texts from businesses in 2025, representing a 35% growth in SMS opt-ins since 2021
What this means for your store
SMS’s instant delivery and high open rates make it ideal for time-sensitive messages, such as flash sales, abandoned cart reminders, and back-in-stock alerts.
Omnichannel tools like Omnisend allow you to craft detailed SMS campaigns with their wide toolset:
SMS vs. email: How performance compares
While both channels are essential for online marketing, these digital marketing statistics reveal that SMS excels in different areas than email:
- Automated SMS generated 26% of all SMS orders from only 13% of sends in 2023, showing strong efficiency
- 93% of consumers text every day, with 45% checking their messages more than 10 times daily
- Texting officially surpassed email as the top way consumers contact customer service in 2025, with 31% preferring SMS over email and phone calls
- 71% of consumers want to be able to text a business back, showing demand for two-way conversations
- SMS users show higher intent — while email works for discovery and nurturing, SMS drives immediate action
What this means for your store
Use email for detailed product information, educational content, and longer customer journeys — reserve SMS for urgent, action-oriented messages where speed matters.
Email + SMS together: Omnichannel uplift
Combining email and SMS in your marketing efforts creates better results than using either channel alone. The following ecommerce marketing statistics show the power of multi-channel strategies:
- Brands sent 31% more SMS messages year-over-year, with automated sends increasing two-fold as businesses recognize the power of multi-channel workflows
- Automated messages significantly outperform campaigns across both email and SMS, with click rates for automated SMS jumping from 7.6% to 9.4%
- 67% of businesses are increasing their SMS marketing budgets in 2025, recognizing this channel as a high-ROI complement to email
- Businesses using SMS are 5.89 times more likely to report digital marketing success than those that don’t
- In the UK, SMS’s global potential became apparent with its 10.65% click-to-conversion rate for SMS campaigns, far exceeding the global average of 2.18%
What this means for your store
Don’t choose between email and SMS — use both. Send an email for initial outreach, then follow up with SMS for cart abandonment. Use email for weekly newsletters, but SMS for flash sales.
Marketing automation and omnichannel statistics
Marketing automation and omnichannel strategies have become pivotal for determining ecommerce success. These digital marketing statistics show how combining automated workflows with coordinated multi-channel messaging can improve your ecommerce marketing results.
Adoption and impact of marketing automation in ecommerce
Automation transforms how efficiently stores convert browsers into buyers. The following digital marketing data highlights its impact:
- Brands sent 250 million more automated emails year-over-year in 2023, with the most significant increases seen in back-in-stock (four times), welcome (nearly three times), and browse abandonment (almost two times) emails
- Order and shipping confirmation emails convert 22 times better than campaign emails, showing the revenue potential of optimized transactional messages
- 81% of businesses say AI has improved their SMS marketing success, with most saving four to six hours per week on average
- Automated emails converted 2,361% better than campaign emails, resulting in 52% higher open rates and 332% higher click rates
What this means for your store
Automated workflows have the potential to increase your revenue while significantly reducing your workload.
Start with the fundamentals (cart abandonment, welcome series, and post-purchase). Then, expand to browse abandonment, product recommendations, and re-engagement campaigns.
Take a look at the array of automation features offered by Omnisend, along with its multichannel workflow:
Omnichannel journeys: Email, SMS, and beyond
Coordinating multiple channels in unified customer journeys yields results that surpass those of single-channel approaches. The following digital marketing statistics support this claim:
- Automated push messages generated 21% of all push orders from only three percent of sends, while automated SMS drove 26% of orders from 13% of sends
- Push notification open rates jumped from 34.3% for campaigns to 58.7% for automated messages
- Consumers who have installed a brand’s app are 18% more likely to develop brand loyalty, showing how mobile apps strengthen customer relationships beyond transactions
- 28% of consumers increased their use of loyalty programs in 2024, a 40% jump from 2023, highlighting the increase in loyalty engagement
What this means for your store
Don’t silo your channels — connect them. Build workflows using email for the initial touchpoint, SMS for urgent follow-ups, and push notifications for instant alerts.
Customers engage with different channels at different times, so meeting them at as many channels as possible increases conversions.
Personalization and triggered workflows by the numbers
Behavior-triggered, personalized messages consistently outperform generic broadcasts based on the following digital marketing stats:
- 89% of marketers see a positive ROI when delivering a personalized experience, highlighting that customized messaging directly impacts revenue
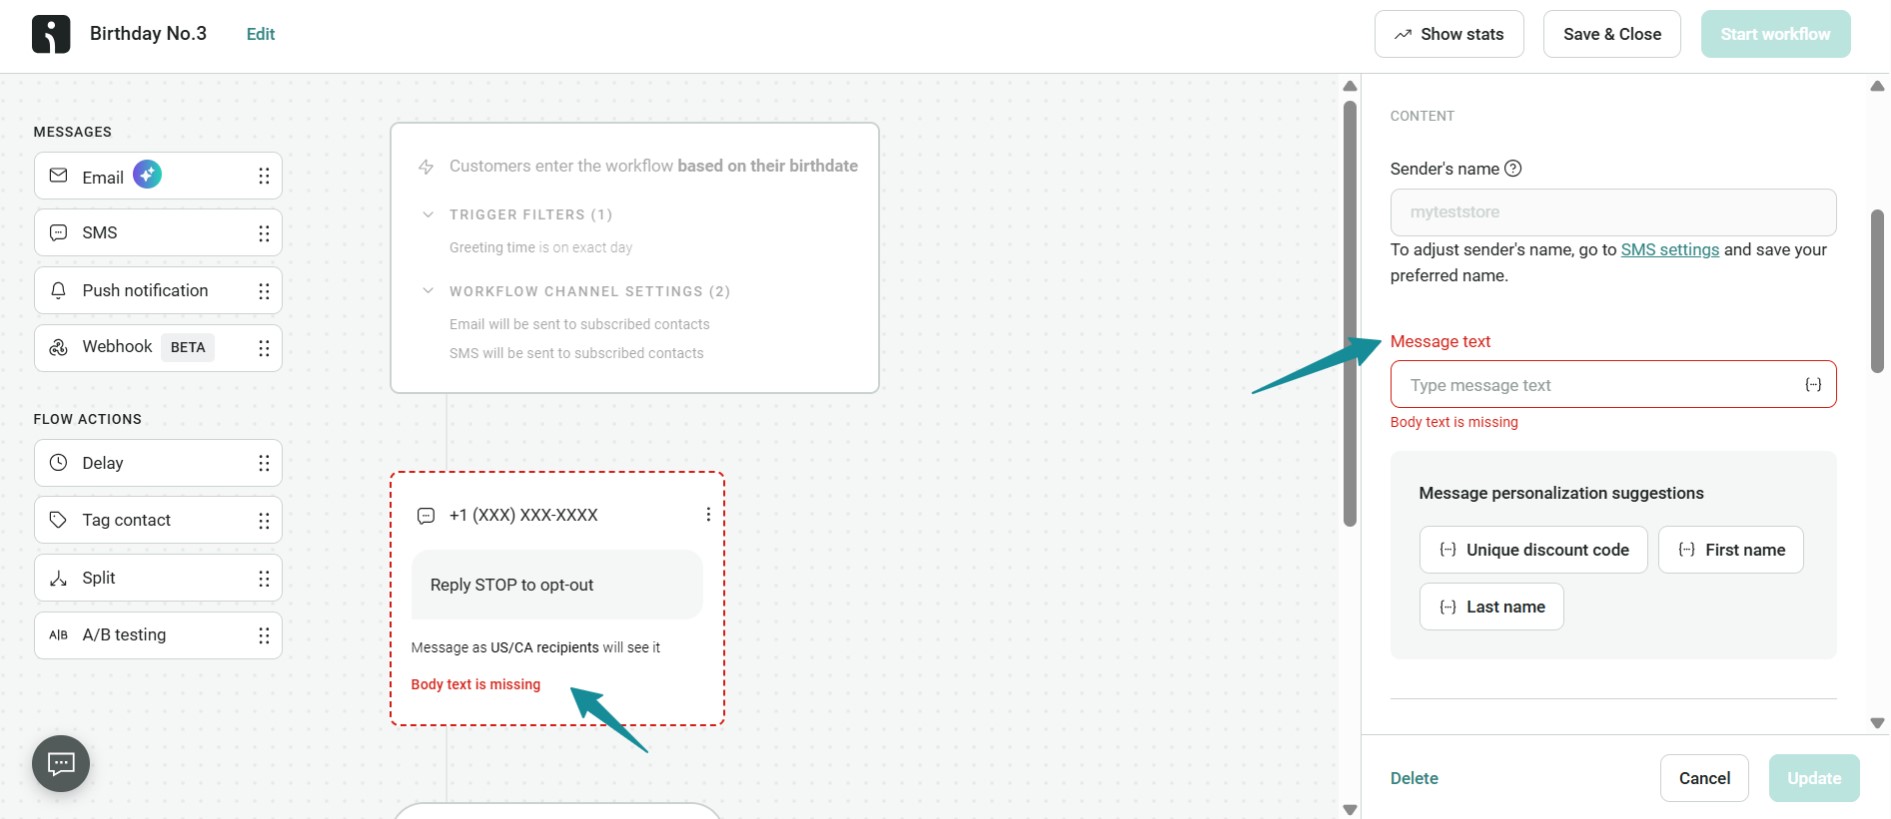
- Birthday emails achieved a 43.3% open rate and 14.3% click-to-conversion rate, showing that personal occasion-based messages create above-average engagement
- App users spend 201 minutes per month shopping compared to just 11 minutes on mobile websites, making apps a critical channel for sales and engagement
- Nearly 75% of shoppers use multiple channels (email, mobile apps, websites, and physical stores) to compare and purchase products
What this means for your store
Generic “batch and blast” campaigns leave money on the table. Utilize customer data to trigger targeted messages based on behavior, demographics, and engagement levels.
Paid advertising and customer acquisition statistics
Paid advertising remains a core driver of growth for online stores. However, with rising costs and shifting consumer behavior, understanding benchmarks for spend, ROAS, and CAC is crucial for effectively managing your marketing budget.
Here’s how digital marketing statistics position paid channels in the ecommerce industry in 2026.
Paid search and shopping ads benchmarks
Google Shopping and search ads scale traffic quickly but at rising costs. These digital marketing statistics help you set realistic CAC expectations for paid search:
- The average ROAS for Google Ads in ecommerce is around 2:1 to 4.5:1
- Median ROAS across ecommerce for Google Ads in late 2025 was 2.95, down slightly as competition intensifies and CPMs rise
- Google Shopping and search campaigns benefit from high-intent traffic — people actively search to buy, not just browse
- Average paid search ROAS sits at 2.26x across industries, making it one of the more stable channels for predictable returns
- Cost per lead (CPL) for Google Ads climbed 5.13% to $70.11 in 2025, reflecting a continued upward trend in acquisition costs for ecommerce stores
What this means for your store
Google Ads continues to deliver solid returns for ecommerce, especially when targeting high-intent keywords and product searches. Focus on conversion rate optimization and landing page experience.
Paid social and retargeting performance data
Facebook, Instagram, and emerging platforms like TikTok offer massive reach. However, performance varies widely based on your product category and creative execution:
- Facebook and Instagram ads average a ROAS of around 2.5:1 to 3:1 for ecommerce, with Instagram hitting 8.83:1 for visual products like fashion and home decor
- Meta’s CPMs hit $10.88 in Q1 2025, up 19.2% from the previous year, making audience targeting and creative refresh cycles even more critical
- Facebook and TikTok drive high click-through rates (CTR) but are less efficient at driving direct sales, which is why they’re better for brand awareness or lower-ticket items
- TikTok ads average a ROAS of around 2:1, though the platform’s young, entertainment-focused audience presents unique challenges for direct response
- Privacy regulation changes (iOS updates, GDPR) have reduced targeting precision by roughly 40%, forcing broader and more expensive audience approaches
What this means for your store
Social ads are most effective when used to build awareness or nurture cold traffic into warmer leads, particularly for visually appealing products.
Customer acquisition cost (CAC) for ecommerce
Rising sharply, CAC has become the make-or-break metric for ecommerce profitability. These digital marketing statistics compare typical costs across paid, organic, and owned channels:
- Average ecommerce CAC ranges from $45 to $175, though this varies significantly by product category, business size, and target market
- CAC has surged by 40% between 2023 and 2025 for ecommerce brands, driven by increased platform competition and reduced targeting precision
- Many ecommerce businesses lose $29 on average per new customer acquired (after accounting for marketing costs and product returns), versus a $9 loss in 2013 — a 222% increase
- The ideal LTV:CAC ratio for ecommerce is 3:1 or higher, meaning each customer should be worth at least three times the acquisition cost
- Digital ad spend worldwide surpassed $1 trillion in 2024, up 9.5% from 2023, reflecting how competitive the paid advertising landscape has become
What this means for your store
Rising CAC is reducing profits across the board, which is why retention and lifetime value have become more critical than ever.
However, you can’t rely solely on paid ads to scale in profit. Focus on building owned channels, such as email and SMS, to nurture existing customers, and use paid media strategically. Here’s how these channels stack up:
| Marketing channel | Average CAC (ecommerce) | Average ROAS/ROI |
|---|---|---|
| Email marketing | N/A | 3,600%–4,000% (Omnisend: 6,800%) |
| SMS marketing | N/A | 2,100%–7,100% |
| Paid search (Google Ads) | $30–$120 | 800% |
| Paid social (Facebook/Instagram) | $9–$451 | 200%–500% |
| Organic search (SEO) | N/A | 748% |
Social media and content marketing statistics for online stores
Social platforms aren’t just for brand awareness anymore. They’re now direct sales channels where discovery, research, and purchase happen in one place. Here’s how social media and content marketing are reshaping ecommerce in 2026.
Social media engagement and ecommerce discovery
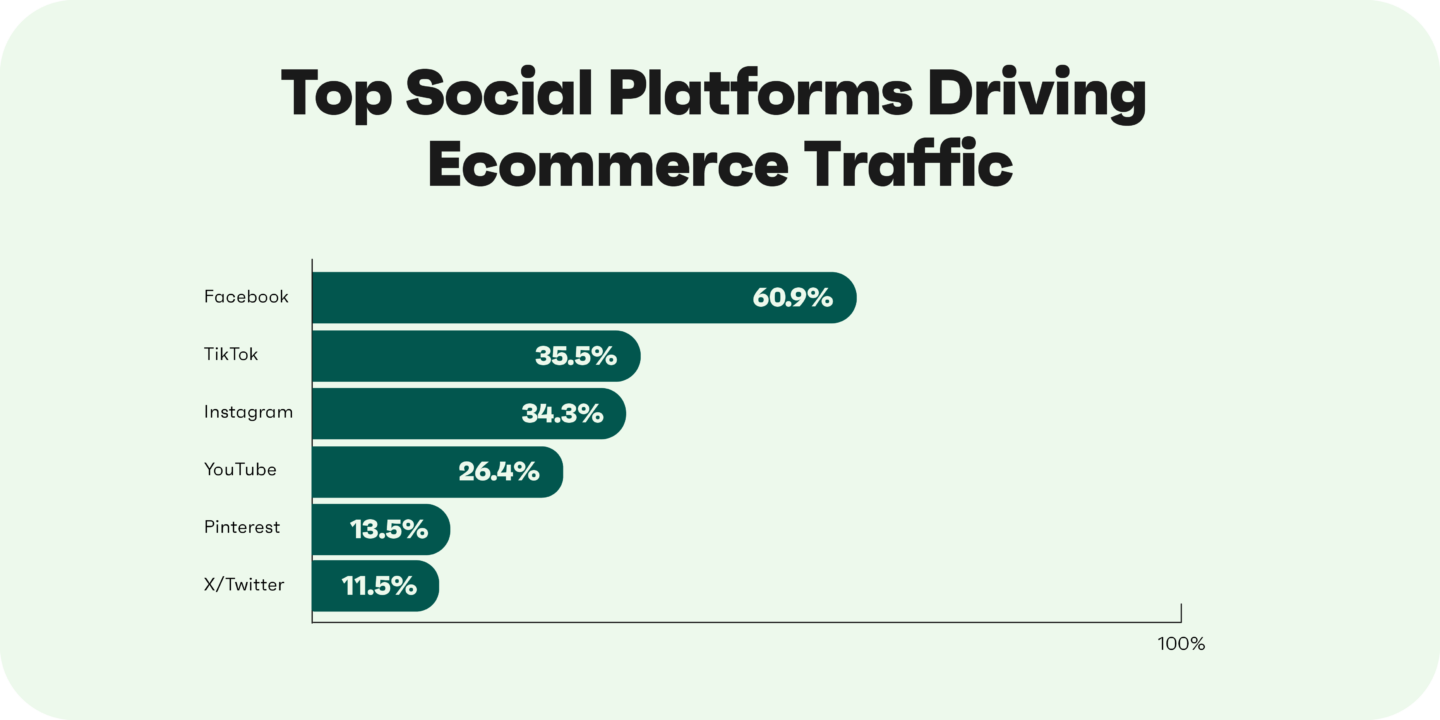
The latest digital marketing statistics show exactly which platforms deliver the best returns for online retailers:
- Shoppers worldwide spent over $997 billion on social commerce in 2024, with projections pointing to a CAGR of 8.36% through 2030
- 57.3% of US internet users research brands or products via social platforms before buying, and globally that number jumps to 72.9% — making social platforms the main channel for brand discovery
- 70% of Instagram’s 1.4 billion active users shop on the platform, while 62.7% use it to follow brands or research products
- TikTok Shop grew US sales by 407% in 2024, hitting $15.82 billion and claiming 18.2% of total US social commerce, with projections to reach 24.1% by 2027
What this means for your store
Social platforms are now primary sales channels. Focus on shoppable content, product tagging, and in-app checkout experiences to meet customers where they’re already spending time.
Content marketing and influencer impact on sales
UGC and influencer partnerships influence purchase decisions differently from branded content. These digital marketing statistics highlight the impact on conversion rates and customer trust:
- Influencer marketing delivers 11 times more ROI than other forms of digital media, with the industry valued at $24 billion by the end of 2024, up from $21.1 billion in 2023
- 33% of customers indicated that UGC is the most authentic visual content, ranking above professional photography (24%) and influencer marketing (18%)
- 84% of consumers are more likely to trust a brand’s marketing campaign if it features UGC, while 40% are less inclined to purchase if there’s no UGC on the product page
- UGC-based ads get more clicks than paid ads, and 77% of shoppers are more likely to buy a product they found through UGC
- 69% of consumers trust influencer recommendations over information from a brand, making influencers powerful third-party validators
What this means for your store
Real customer photos, reviews, and influencer partnerships drive more sales than studio-shot product images.
Build systems to collect, curate, and showcase UGC across your site and social channels. Consider micro-influencer partnerships for authentic reach without breaking the bank.
SEO and organic traffic statistics for ecommerce
Search engine optimization drives qualified traffic to online stores without the recurring costs of paid ads (not including labor or content costs). These digital marketing statistics demonstrate why SEO is crucial for ecommerce in 2026 and how it compares to other channels.
Organic traffic share and conversion benchmarks
Organic search visitors convert at higher rates than most paid traffic, while having no direct cost per click. These digital marketing statistics show why SEO remains a critical long-term investment:
- Retail and ecommerce businesses earn 44.6% of their revenue from organic search, more than any other single channel
- SEO delivers an average ROI of 748%, significantly outperforming most paid advertising channels
- Organic searches drive 53% of website visits, with paid channels, social platforms, and direct traffic splitting the rest
- The top spot in Google captures 27.6% of all clicks, while only 0.63% of searchers click on the second page of SERPs
- 76% of people who search for something nearby visit a business within a day
What this means for your store
Digital marketing statistics clearly show that SEO generates significant returns over time.
Focus on ranking for product keywords that your customers actually search. Optimize local SEO if you serve a specific area. Aim for those top positions where most shoppers click.
Content and SEO trends impacting ecommerce
Product discovery via searches keeps evolving. Current digital marketing statistics help you prioritize which SEO trends actually move revenue:
- Long-form content generates 77% more backlinks than shorter articles, which is why comprehensive product pages with detailed specifications and guides are critical for SEO performance
- 72.9% of pages that rank in the top 10 are three years old or older, showing that solid content holds its value
- Two-thirds of published pages don’t earn a single backlink, opening opportunities for stores that create genuinely helpful content
- AI-generated summaries like Google’s AI overviews now show up in 13% of searches, which changes how shoppers interact with results
- Google’s algorithm weighs hundreds of signals, but quality content, user experience, and inbound links matter significantly
What this means for your store
Short, unclear product descriptions don’t rank as well as well-drafted copy. Create buying guides, how-to content, and comparison pages that genuinely assist shoppers in making informed decisions.
Target featured snippets to appear in AI summaries. Remember that digital marketing data shows SEO takes months to gain momentum, but marketing statistics show that results can compound year after year.
Mobile and cross-device ecommerce marketing statistics
Smartphones drive the majority of online shopping activity. However, converting mobile browsers into buyers requires different tactics than desktop. Here’s what digital marketing statistics reveal about mobile commerce.
Mobile traffic and conversion patterns for ecommerce
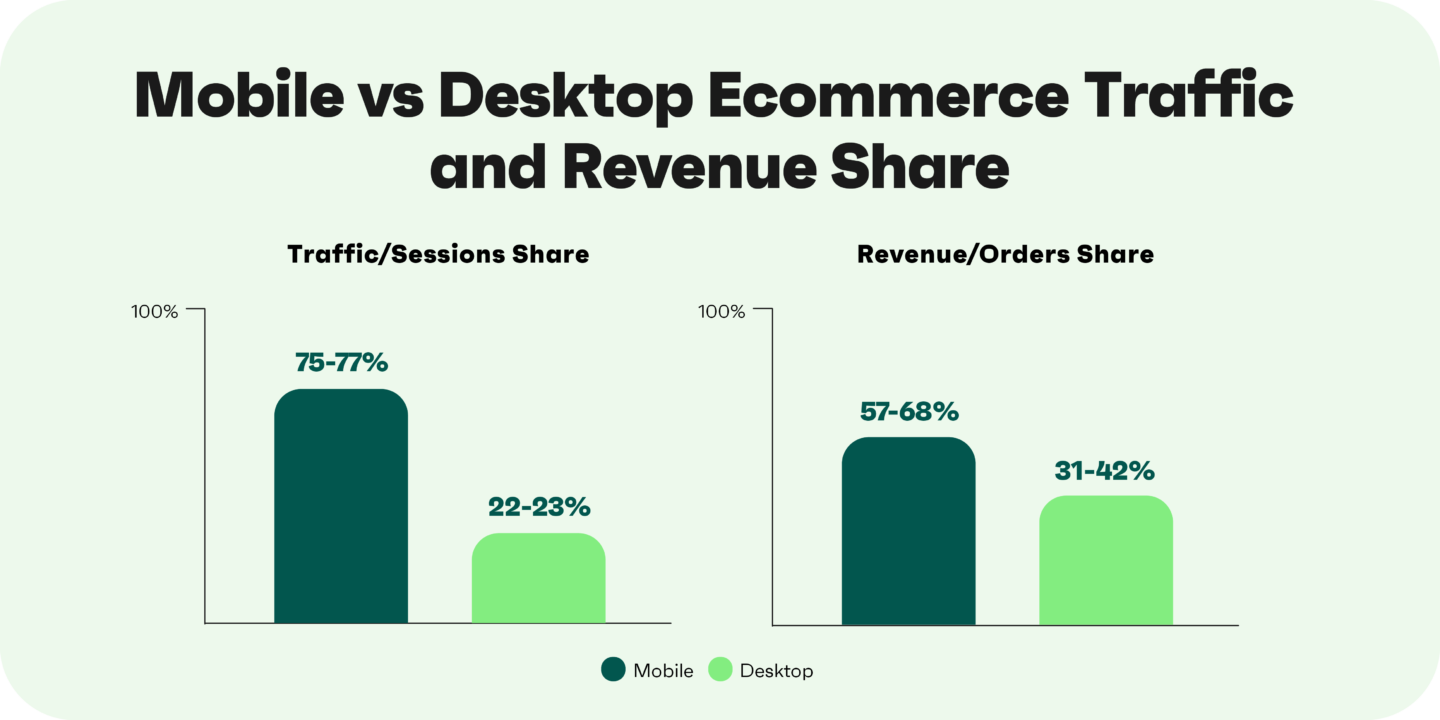
Nowadays, most ecommerce traffic comes from smartphones. However, conversion patterns vary significantly between devices. Understanding these mobile-specific digital marketing statistics helps you know how to optimize your brand for mobile devices:
- Mobile devices account for 78% of retail website visits and 68% of online orders worldwide, making it the primary way shoppers discover and buy products
- US mobile shoppers spent $564 billion in 2024, up nearly 15% from the previous year, with projections reaching $648 billion in 2025
- Mobile conversion rates average 1.8%, about 29% higher than desktop at 1.4%, though cart abandonment runs higher at 85% on phones versus 74% on computers
- Mobile apps convert three times better than mobile websites and five times better than desktop apps
- 72% of North American consumers use their smartphones for in-store price comparisons, making mobile research the most common shopping behavior in physical stores
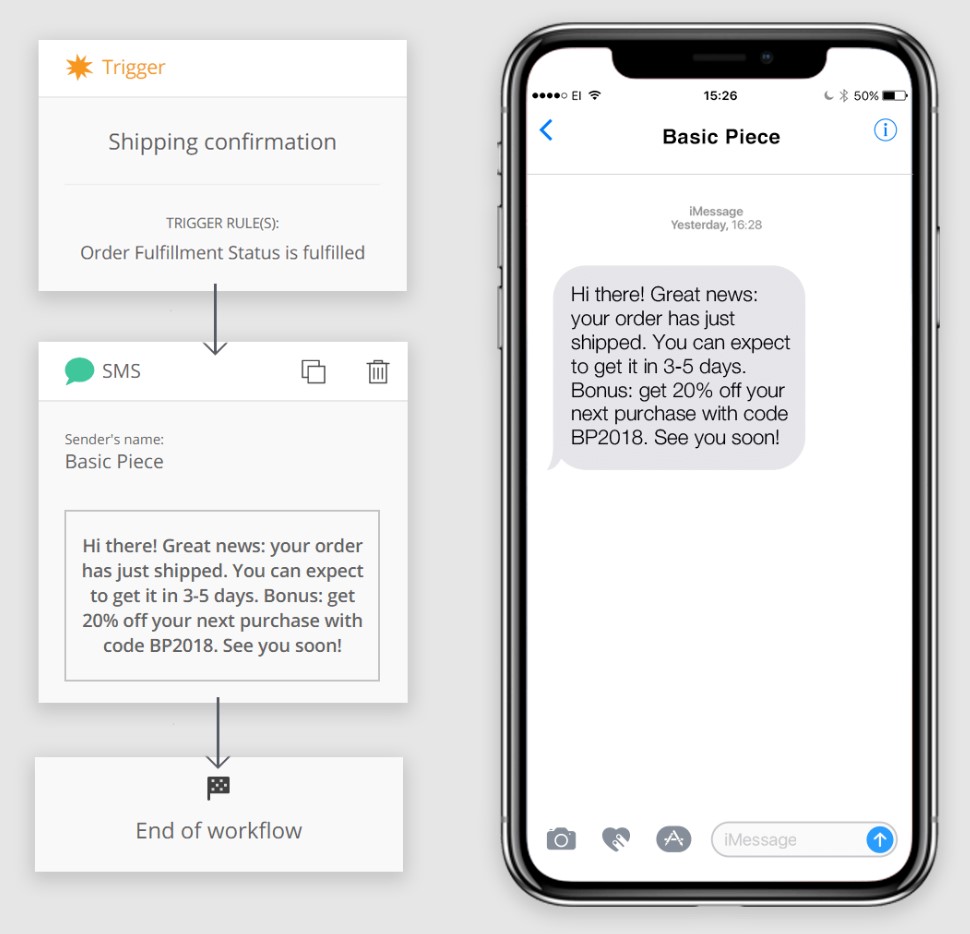
What this means for your store
Most of your traffic comes from phones, so your mobile experience can’t be an afterthought. Focus on fast load times, simple navigation, and streamlined checkout. Here’s an example of an active SMS automation flow from Omnisend, targeting mobile users:
Mobile-friendly messaging: Email and SMS performance
Email and SMS both perform exceptionally well on mobile devices, where most people check their messages:
- Mobile accounts for over 73% of Google visitors, making up the vast majority of search traffic that lands on your site
- American desktop web users perform an average of about 126 unique Google searches per month — roughly 4.2 searches per day
- 56% of email marketing professionals have indicated plans to optimize email design for mobile devices
- SMS messages are opened within three minutes on average, making text messaging the fastest way to reach customers via mobile
- Apps that use both push notifications and in-app messaging see an average 31% higher engagement score compared to their app category average, highlighting that strategic mobile messaging drives stronger user interaction
What this means for your store
Digital marketing statistics indicate that mobile-optimized messaging yields better engagement across various channels.
Ensure your emails display correctly on small screens — test SMS campaigns for time-sensitive promotions to ensure optimal display on all devices. If you have an app, use push notifications to bring customers back. They’ll immediately see these alerts when they’re on their phones.
Customer retention, loyalty, and lifecycle statistics
Acquiring new customers is great, but don’t overlook repeat buyers as they drive profit. These digital marketing statistics show why retention matters more than most ecommerce brands realize.
Repeat customer revenue share and LTV benchmarks
Repeat customers generate nearly half of all ecommerce revenue while representing a fraction of the customer base. Digital marketing statistics around LTV show why retention investments pay off quickly:
- Repeat customers account for 44% of total revenue despite representing only 21% of the customer base, showing how valuable each loyal buyer becomes over time
- Industry-wide, existing customers generate 65% of total business through repeat purchases, upsells, and referrals
- After their first purchase, customers have a 27% chance of buying again, increasing to 49% after their second purchase
- Repeat customers have a six to seven times higher lifetime value than new customers
- Average ecommerce CLV ranges from $100 to $300, but this varies significantly by industry and product category
What this means for your store
If you’re spending most of your budget chasing new customers, you’re missing the bigger opportunity. Focus on keeping your current customers happy, and they’ll naturally spend more over time.
Retention vs. acquisition: Cost and impact
Acquiring new customers costs more than retaining existing ones, yet most brands still overspend on acquisition. These digital marketing statistics make the case for rebalancing your budget toward retention:
- In 2013, ecommerce businesses paid an average of $9 to acquire a new customer, which rose to $29 by 2022 — highlighting a rising trend in acquisition costs
- 56% of shoppers become repeat buyers after personalized experiences, and 60% of business leaders say personalization is an effective strategy for acquiring new customers
- With younger consumers wanting better digital experiences and more personalization, 92% of businesses now use AI-driven personalization to drive growth
- The average customer retention rate across all industries is approximately 75.5%, with media and professional services leading at 84%
What this means for your store
Digital marketing statistics clearly indicate that retaining existing customers is more profitable than acquiring new ones. Every dollar you invest in keeping customers happy generates better returns than chasing new ones, especially with rising ad costs.
Lifecycle campaigns that improve loyalty
Welcome series, replenishment reminders, and winback campaigns keep customers engaged throughout their lifecycle. Recent digital marketing statistics reveal which automated flows deliver the highest retention ROI:
- 83% of companies with loyalty programs report positive ROI, averaging 5.2x — some programs achieve up to 4.9x more revenue than expenses
- 73% of brands agree that AI adoption will fundamentally change personalization and marketing strategies
- Supplement brands using subscriptions and loyalty programs saw repeat purchase rates jump to 37.7%, up from 33.1% the previous year, with retention rates climbing from 19% to 23.4%
- Customer retention rates vary by industry, from 55% in hospitality and travel up to about 84% in media and professional services, highlighting how loyalty differs across sectors
What this means for your store
Set up automated welcome series, replenishment reminders, and winback campaigns through email and SMS. Launch a simple loyalty program that rewards repeat purchases. You can achieve this with email marketing platforms like Omnisend.
Ecommerce marketing budget allocation and channel ROI
Deciding how much and where to spend your marketing budget makes the difference between profitable growth and wasted money. Here’s what digital marketing statistics tell us about budget allocation.
How much ecommerce brands spend on digital marketing
Marketing budgets (as a percentage of revenue) vary by growth stage and industry. These digital marketing statistics provide benchmarks to help you gauge whether you’re underspending or overinvesting:
- Ecommerce companies typically spend 10% to 20% of revenue on marketing, though newer brands may dedicate more
- Overall, marketing budgets fell to 7.7% of company revenue in 2024, down from 9.1% in 2023, marking a 15% year-over-year drop
- Ecommerce brands spend an average of about $8,000 per month on marketing, though this varies significantly based on business size and growth goals
- Small businesses typically allocate 7% to 12% of revenue to marketing, with growth-stage companies spending 10% to 15%
- Companies gaining market share increase spending even in economic downturns, making marketing investment crucial during these times
What this means for your store
If you’re spending less than 7% of revenue on marketing, you’re leaving growth on the table. If you’re spending more than 20% without seeing profitable returns, it’s time to rebalance your channel mix and focus on ROI rather than just volume.
Channel-by-channel ROI and cost comparison
Not all marketing channels deliver the same returns, and these digital marketing statistics show the clear winners:
- Email provides an ROI of $36 to $40 for every dollar spent, making it the highest-performing ecommerce marketing channel
- Omnisend’s US ecommerce customers achieve $79 per dollar spent on email marketing, doubling the industry average through automation and omnichannel campaigns
- A Bloomreach case study showed that SMS marketing can deliver an ROI of up to 7,433%, outperforming email’s 3,600%, but it comes with higher per-message costs
- Conservative estimates put SMS returns between $21 and $41 per dollar invested, still significantly outperforming paid advertising channels
- On average, ecommerce SEO delivers about $2.75 in revenue for every dollar invested, while Google Ads generates $8 profit for every dollar spent
What this means for your store
Email and SMS are the foundation of your marketing efforts. They deliver three to ten times better ROI than paid channels, cost less to scale, and give you direct access to customers. That said, here’s how ecommerce marketing channels stack up:
| Marketing channel | Average ROI | Implementation effort | Monthly cost range |
|---|---|---|---|
| Email marketing | $36–$42 per dollar spent (Omnisend customers: $76 per dollar) | Low-medium | $16–$300/month |
| SMS marketing | $21–$71 per dollar spent | Low | Pay per message |
| SEO (organic search) | $7.48 per dollar spent | High | $500–$5,000/month |
| Google Ads (paid search) | $8 per dollar spent | Medium | $1,000–$10,000/month |
| Paid social (Facebook/Instagram) | $2–$5 per dollar spent | Medium | $500–$5,000/month |
Sample budget allocations by growth stage
Early-stage stores need different channel mixes than established brands. Here are the typical budget splits for stores at various revenue levels:
Early-stage stores (under $1M revenue):
- Allocate 15% to 20% of revenue to marketing during early growth phases to build brand awareness and test channels
- Focus: 45% paid advertising (testing), 35% email/SMS (building lists), 20% content/SEO (foundation)
- Priority: Customer acquisition and finding product-market fit
Growth-stage stores ($1M to $10M revenue):
- Spend 10% to 15% of revenue on marketing as you scale, what works, and improve efficiency
- Focus: 45% paid advertising (scaling top-performing ads), 30% email/SMS (automation), 25% content/SEO/retention
- Priority: Scaling profitable channels and improving CLV
Established stores ($10M+ revenue):
- Maintain 7% to 12% of revenue for marketing with emphasis on retention and brand building
- Focus: 30% paid advertising (maintenance), 45% email/SMS/loyalty (retention), 25% brand/content
- Priority: Customer retention, referrals, and maximizing CLV
What this means for your store
Don’t simply copy someone else’s budget split. Your budget allocation should reflect your growth stage, profit margins, and which channels actually work for your business.
Track ROI diligently and allocate the budget toward strategies that deliver results, even if it means going against conventional wisdom.
How to benchmark your store and build a 2026 marketing plan
You’ve seen the essential digital marketing statistics. Now, let’s turn them into a concrete marketing plan for your store.
Step 1 — Benchmark your current performance
Start by comparing your numbers against the ecommerce benchmarks and digital marketing statistics covered in this article.
Gather your metrics for the past 12 months:
- Revenue breakdown: Verify what percentage comes from repeat customers versus new customers (target 44% to 65% from repeat buyers)
- Marketing spend: Confirm whether you’re investing 7% to 12% of revenue in marketing, or significantly more or less
- Email performance: Compare your open rates, click rates, and revenue per recipient against industry averages for ecommerce
- SMS engagement: If you’re using SMS, check your opt-in growth rate and conversion rates
- Customer acquisition cost: Calculate your CAC by channel and compare it to your customer lifetime value (aim for a 3:1 LTV to CAC ratio)
- Channel ROI: Find out which channels are delivering positive returns and which are draining your budget
You can use Omnisend’s reporting dashboard to track these metrics in one place. Alternatively, you can pull data from your email platform, ad accounts, and ecommerce platform to build a complete picture. Here’s a look at what the dashboard looks like on Omnisend:
What this step reveals: You’ll quickly see where you’re ahead of the curve and where you’re falling behind. Most stores discover they’re over-investing in paid ads and under-investing in email and SMS automation.
Step 2 — Identify your biggest opportunities
After benchmarking your performance, find the gaps that could bring the biggest wins. Here are some common high-impact opportunities based on the digital marketing statistics covered in this article:
- Low repeat purchase rate: If less than 50% of your revenue comes from repeat customers, focus on retention via email automation, loyalty programs, and lifecycle campaigns
- Underperforming email: If your email ROI is below $36 per dollar spent, it’s likely caused by weak segmentation, poor automation, or infrequent sends
- No SMS strategy: Stores without SMS miss out on a channel that delivers $21 to $71 per dollar spent, with 98% open rates
- Manual campaigns only: If you’re sending only bulk emails and haven’t set up automated workflows, you’re missing out on 41% of potential email orders that come from just 2% of sends
- High CAC, low LTV: If your CAC is eating up profits, shift budget from paid ads to retention tactics that increase lifetime value
- Mobile conversion gaps: With 78% of ecommerce traffic coming from mobile, but with lower conversion rates, improving mobile UX and mobile-optimized messaging delivers fast gains
Prioritize the gaps where minor improvements create the most significant revenue impact. Fixing a broken abandoned cart flow typically delivers faster results than launching a new paid channel.
What this step reveals: This will show the two or three changes that will move the needle most for your store based on where you’re weakest compared to benchmarks.
Step 3 — Allocate your budget based on data
Now that you know your opportunities, reallocate your 2026 budget based on known digital marketing statistics. Here’s a quick guide:
- Foundation channels first: Allocate at least 40% to 50% of your budget to email and SMS since they deliver up to 10 times more ROI than paid channels
- Paid for acquisition: For growth-stage to established stores, you can reserve 30% to 40% for paid advertising focused purely on acquiring new customers, not retargeting existing ones
- Content and SEO: Dedicate 10% to 15% to organic channels that reduce long-term CAC and build brand authority
- Testing budget: Hold back five to ten percent for experiments like new channels, creative tests, or seasonal campaigns
If your current split looks dramatically different, create a transition plan to rebalance over two to three quarters rather than making drastic cuts overnight.
Calculate expected returns using channel benchmarks. If you’re investing $50,000 annually in email at a $36 per dollar ROI, you should expect to recoup $1.8 million. If you’re not seeing those returns, your implementation needs improvement, not just a larger budget.
What this step reveals: Determine a realistic budget that aligns spending with the channels proven to deliver the best returns for ecommerce, not just the loudest or newest options.
Step 4 — Implement and track with automation
Finally, put your plan into action with the right tools and tracking systems. Set up automated workflows that work while you sleep:
- Welcome series: Three to five emails introducing new subscribers to your brand and products
- Abandoned cart: Email and SMS reminders sent within one hour, 24 hours, and three days after cart abandonment
- Browse abandonment: Emails triggered when someone views products but doesn’t add to the cart
- Post-purchase: Thank-you emails, review requests, and replenishment reminders timed to your product cycles
- Winback campaigns: Re-engagement flows for customers who haven’t purchased in 60 to 90 days
You can use marketing reports and dashboards to track performance on a weekly basis, rather than monthly. Quick feedback loops enable you to identify problems and opportunities more quickly.
Set quarterly review points to assess:
- Which channels are beating their ROI targets and deserve more budget
- Where you’re falling short of benchmarks and need to adjust tactics
- New opportunities emerging from customer behavior changes
- How does your overall marketing efficiency compare against your goals
Marketing platforms like Omnisend make this easier by combining email, SMS, and automation in one platform with built-in reporting for ecommerce. This way, you’re measuring what actually matters, such as revenue, not just opens and clicks.
What this step delivers: Come up with a marketing plan that runs automatically, tracks performance against benchmarks, and improves continuously based on real data instead of guesswork.
Conclusion
These digital marketing statistics paint a clear picture for 2026. Email and SMS remain the highest-ROI channels for ecommerce, delivering $36 to $79 per dollar spent compared to $2.5 to $3 from paid advertising.
The stores that win in 2026 won’t be the ones spending the most on marketing. They’ll be the ones using digital marketing statistics to benchmark performance, identify gaps, and allocate budget based on ROI rather than hype.
Start with your foundation — email and SMS automation. Then, layer in paid channels to acquire customers you can retain through owned channels.
Digital marketing statistics only matter when you act on the data. Use ecommerce-focused platforms like Omnisend to put these insights into practice. Leverage powerful automation, intuitive workflows, and reporting.
Get started with Omnisend and combine email, SMS, and automation explicitly built for ecommerce
Quick sign up | No credit card required
FAQs
What is the success rate of digital marketing?
Digital marketing success varies by channel. Email delivers $36 for every dollar spent, while SMS returns $21 to $71 per dollar. Paid ads average a return of $2.5 per dollar, and SEO delivers $2.75 per dollar invested.
What is the ROI of email marketing for ecommerce?
Email marketing delivers an average ROI of $36 per dollar spent, or 3,600%, for ecommerce businesses. Top-performing ecommerce brands using platforms like Omnisend achieve $79 in revenue for every dollar spent through automation and personalization strategies.
How much should ecommerce businesses spend on digital marketing?
Ecommerce businesses typically allocate 7% to 12% of total revenue to marketing. Early-stage stores often spend 15% to 20% to drive growth, while established brands maintain 7% to 10% on retention and efficiency.
Which digital marketing channel has the highest ROI?
If we focus solely on ROI, SMS has a high ROI of $21 to $71 per dollar spent, followed closely by email, with an ROI of $36 per dollar. These owned channels significantly outperform paid advertising, which delivers $2.50 for every dollar invested.
How effective is SMS marketing compared to email?
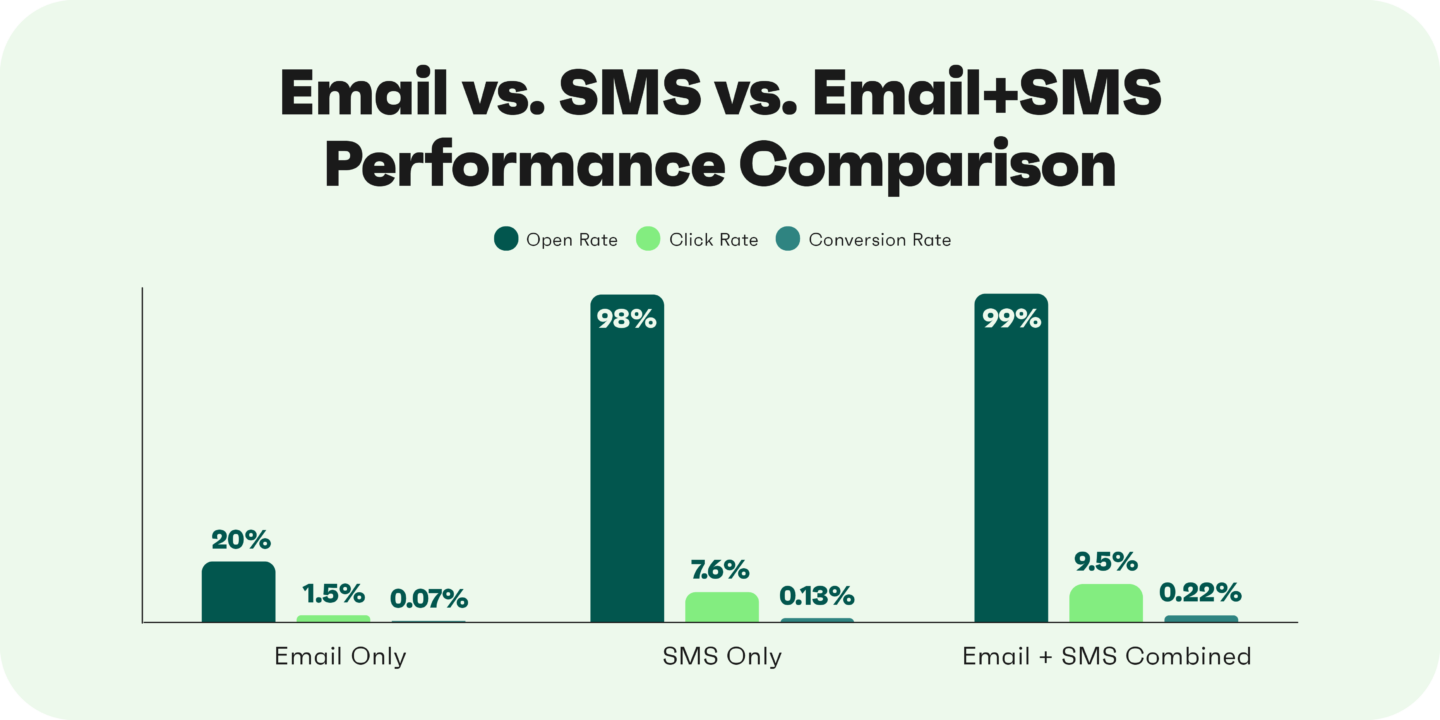
SMS achieves 98% open rates compared to email’s 26.6%, with messages being read within three minutes. SMS generates $21 to $71 ROI per dollar compared to email’s $36.
TABLE OF CONTENTS
TABLE OF CONTENTS

Subscribe and don’t miss any updates!
No fluff, no spam, no corporate filler. Just a friendly letter, twice a month.