
 OFFER
OFFER


Drive sales on autopilot with ecommerce-focused features
See FeaturesKey takeaways
Email delivery rate shows you the percentage of emails that the recipient’s server accepts
To calculate your email delivery rate, use this formula: (Emails Sent − Bounced Emails) ÷ Emails Sent × 100
A healthy email delivery rate for ecommerce brands usually falls between 95% and 99% — anything below 90% is critical
Poor list hygiene, high bounce rates, and weak authentication can lower your email delivery rate
Clean your list often, re-engage inactive subscribers, use a trusted ESP, and track trends to improve delivery rate
Reveal key takeaways
Many ecommerce marketers confuse email delivery rate with email deliverability. Your email delivery rate only tells you that the receiving mail server accepted your messages. Deliverability tells you whether customers actually see those emails in their inboxes.
This gap matters most for Shopify, WooCommerce, Wix, and BigCommerce stores sending at volume. A Shopify store sending 50,000 emails a month can show a strong email delivery rate, while a significant share of those messages never reach the primary inbox.
AI filtering makes this worse. Gmail and Outlook now use algorithmic systems that technically accept your message — keeping your delivery rate intact — but quietly push irrelevant content to promotions, spam, or low-priority folders. Research shows that these systems still deprioritize up to 40% of emails that reach a Gmail inbox.
Ecommerce brands feel this directly. Emails that never reach the inbox mean missed sales, failed cart recovery, and customers who never got your message.
This guide covers what email delivery rate means, how to calculate it, what good benchmarks look like, how it differs from deliverability, and how to improve both.
Make it to your customers’ inboxes with Omnisend’s built-in delivery and deliverability tracking tools
Quick sign up | No credit card required
What is the email delivery rate?
Email delivery rate measures how many of your emails the recipient’s mail server accepted. It doesn’t tell you whether the email reached the inbox — just that Gmail or Outlook didn’t reject or bounce it.
Email delivery rate calculation formula:
Email delivery rate = (Emails Sent − Bounced Emails) ÷ Emails Sent × 100
The standard email delivery rate formula used across email marketing platforms
This means if you send 10,000 order updates or promotional emails and 200 bounce, your email delivery rate is 98%.
Email delivery rate vs. email deliverability: Why the difference matters
Many ecommerce marketers often confuse email delivery rate and email deliverability. The email delivery rate simply tells you whether receiving mail servers accepted your message. In contrast, email deliverability shows whether the accepted emails land in your customer’s inbox, promotions tab, or spam folder.
Picture email delivery rate as a mail carrier dropping a package at your house. The package arrived, so the delivery is complete. But email deliverability decides what happens next. Does the package make it to your kitchen counter (inbox), where you’ll see it right away, or does it end up forgotten in the basement like a spam email nobody opens?
Email delivery rate and email deliverability measure different things — both are crucial for ecommerce brands.
| Aspect | Email delivery rate | Email deliverability |
|---|---|---|
| Definition | Percentage of emails accepted by the recipient’s mail server | Number of emails that reach the inbox |
| What it measures | Delivered vs. bounced emails | Inbox vs. spam placement |
| Formula | Delivered emails ÷ Emails sent) × 100 | (Inbox emails ÷ Emails sent) × 100 |
| Good benchmark | 95%–99% | 80%–95%+ |
| What it doesn’t tell you | Whether emails landed in spam or the inbox | Server rejection reasons |
Why a 98% delivery rate doesn’t mean 98% inbox placement
Even with a 98% email delivery rate, 30% of your emails may still land in spam. Others could be deprioritized by AI filters, lowering visibility.
This example shows how a high email delivery rate can mask deliverability issues:
- You send 10,000 promotional emails
- 9,800 emails reach receiving servers
- Your email delivery rate becomes 98%
- But 2,000 of those emails land in spam
- Only 7,800 emails actually reach the inbox
- Your real inbox placement rate becomes 78%
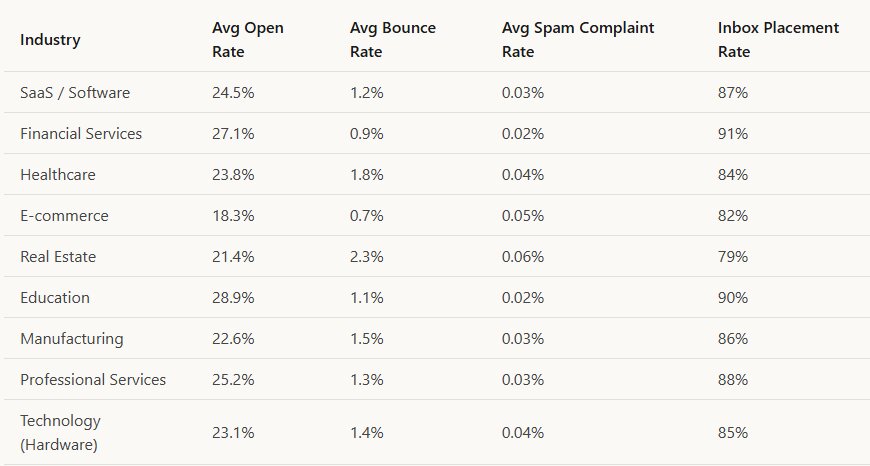
Distinguishing the two metrics is crucial because ecommerce revenue depends on email visibility, not only server acceptance. According to a Validity report, the average inbox placement rate was 87.2% in 2025. That means nearly 12.8% of emails never reached the inbox.
If spam filters hide your campaigns, shoppers never see your offers, cool new arrivals, or abandoned cart emails. That’s why ecommerce store owners should keep a close eye on both email delivery rate and email deliverability.
How to calculate email delivery rate
Calculating your email delivery rate is simple once you know which numbers to use. You need to gather the total number of emails sent and the total number of bounced messages.
Follow this step-by-step process:
1. Find your total emails sent
Open your email marketing dashboard and select the specific campaign you want to analyze. Then locate the total number of emails sent. For example, this could be 10,000 emails.
2. Find your bounced emails
Next, check the total number of emails bounced. This includes hard and soft bounces. Let’s say 200 emails out of the total sent emails bounced.
3. Subtract bounced emails from sent emails
Now subtract the bounced emails from the total sent to get the number of delivered emails:
10,000 – 200 = 9,800 delivered emails
4. Divide by total sent and multiply by 100
Take the delivered emails and divide by the total sent:
9,800 ÷ 10,000 = 0.98
Then multiply by 100:
0.98 × 100 = 98%
Your email delivery rate is 98%.
Here’s the calculation formula you can use:
Email Delivery Rate = [(Emails Sent − Bounced Emails) ÷ Emails Sent] × 100
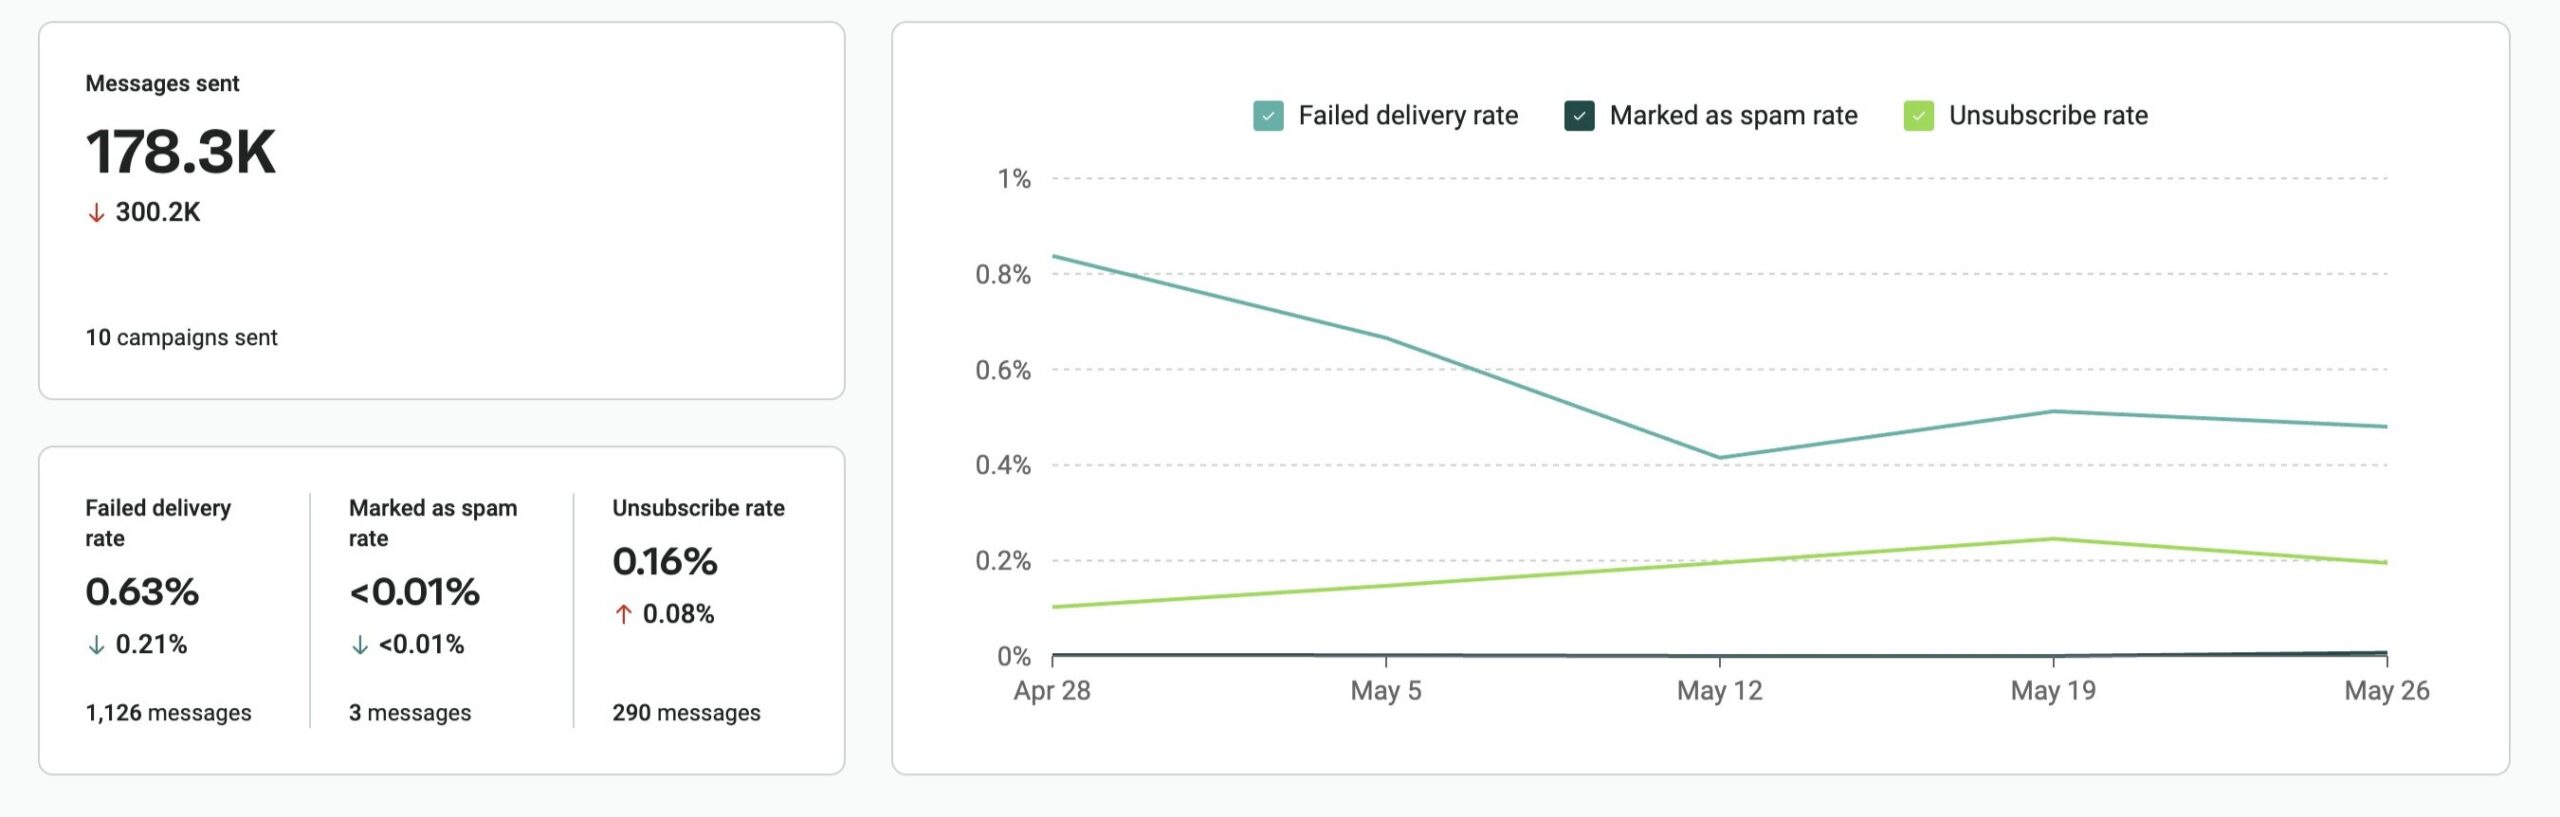
Omnisend shows both sent and bounced email counts directly inside campaign reports. You can find these numbers alongside email marketing metrics like opens, clicks, orders, and revenue attribution.
Here’s Omnisend’s campaign report showing sent vs. bounced data for email delivery rate tracking:
What is a good email delivery rate?
For most ecommerce brands, a healthy email delivery rate falls between 95% and 99%. A score above 98% usually signals strong sending practices and healthy list quality. Anything below 90% raises red flags, such as low-quality email lists and a damaged sender reputation.
Still, benchmarks vary based on email type, sending habits, and target audience.
Email delivery rate benchmarks by tier
Your email delivery rate can tell you a lot about your list quality, sender reputation, and overall email health. The table below gives you a quick way to measure where you stand and what to do next.
| Tier | Delivery rate range | What it signals | Recommended action |
|---|---|---|---|
| Excellent | 99%+ | Strong sender reputation and healthy email list | Maintain sending best practices, continue list cleaning, and monitor results regularly |
| Acceptable | 95–98% | Healthy delivery rate, but minor list quality or engagement issues | Review bounce reports, remove inactive contacts, and keep tracking trends |
| Needs attention | 90–94% | Increasing deliverability issues — your list may contain outdated or risky contacts | Audit your list, check signup sources, and review email authentication settings |
| Critical | Below 90% | Too many emails fail to reach the mail server, affecting campaign performance and revenue | Pause list growth tactics if needed, clean your list immediately, and investigate bounce causes |
For ecommerce senders, even a small drop in email delivery rate means fewer clicks and missed orders. During peak periods like Black Friday or Cyber Monday, a sudden spike in sending volume can make that worse.
Email delivery rate benchmarks by email type
So, what is the average email delivery rate? The answer depends on the types of emails you send. Each ecommerce email type performs differently.
Here’s a breakdown of common ecommerce email types and their benchmarks:
| Email type | Benchmark | Key note |
|---|---|---|
| Transactional emails (order confirmations, password resets, shipping updates) | 99%+ | Customers expect these time-sensitive emails, so they usually have the highest email delivery rate |
| Promotional campaigns (newsletters, product launches, sales emails) | 92%–95% | These emails often face more filtering because they go to larger lists and contain marketing content |
| Automated flows (welcome emails, browse abandonment, cart recovery) | 95%–98%+ | These emails usually perform well because they trigger based on customer behavior and are relevant |
To get a true picture of your email delivery rate, track each campaign type separately. If you only watch your overall average, you may miss important issues affecting individual email streams.
What affects your email delivery rate?
Mailbox providers look at several signals before accepting your emails. The four main factors that influence delivery rate in email marketing are bounce rate, sender reputation, email authentication, and list quality.
Let’s look at how each one affects your results.
Bounce rate (hard vs. soft)
Bounce rate directly impacts your email delivery rate. When an email bounces, it means it didn’t reach the receiving server.
There are two main types of bounces:
- Hard bounces: These are permanent delivery failures. They happen when the receiving email address is invalid, misspelled, fake, or no longer active. Hard bounces damage your sender’s reputation. You must delete these addresses from your list immediately so you never email them again.
- Soft bounces: As the name suggests, these are temporary delivery failures. They occur when a customer’s inbox is full or their email server is down. Soft bounces don’t hurt your email delivery rate right away, but repeated cases can become a problem. If a contact keeps bouncing, suppress it from future sends.
Sender reputation
Internet service providers (ISPs) like Gmail, Outlook, and Yahoo assign your domain a reputation score based on your sending history. They use it to decide whether to accept, filter, or block your emails.
Here are the signals they use:
- Engagement: Whether customers open, reply to, or click on your emails
- Spam complaints: How often recipients mark your emails as spam
- Bounce rates: The share of emails that fail to deliver
Ecommerce brands with seasonal volume spikes — such as Black Friday and holiday campaigns — are particularly vulnerable to reputation dips. A sudden increase in sending volume can trigger filtering even on a previously healthy domain.
Bulk senders who send over 5,000 emails each day now face tighter rules from Google and Yahoo. Your spam complaint rate should remain below 0.1% and should never climb to 0.3% or more. If it does, your domain can face delivery penalties, throttling, or outright blocks.
Email authentication (SPF, DKIM, DMARC)
Email authentication tells receiving mail servers that your emails are legitimate. It proves the message came from you and not from someone pretending to be your brand.
Since 2024, Google and Yahoo have tightened authentication requirements for bulk senders. These major inbox providers now require three protocols to ensure consistent email delivery rates:
- SPF (Sender Policy Framework): Lists the specific servers permitted to use your domain name
- DKIM (DomainKeys Identified Mail): Adds a digital verification to your emails, proving no one changed the message after you sent it
- DMARC (Domain-based Message Authentication, Reporting, and Conformance): Tells providers what action to take if emails fail authentication
Once DMARC is in place, you can add BIMI (Brand Indicators for Message Identification). The feature displays your official logo right next to your name in the customer’s inbox. This helps you build trust and increase brand recognition.
However, BIMI requires you to set your DMARC policy to strict safety modes like “p=quarantine” or “p=reject.”
You can use the latest Common Mark Certificate (CMC). Unlike older Verified Mark Certificates, a CMC doesn’t require an expensive registered trademark to display your logo. This makes BIMI accessible to new or smaller ecommerce stores on a budget.
List quality and how you acquire subscribers
Your list acquisition strategy directly affects your future email delivery rate. If you use bad tactics to grow your audience, you’ll end up with fake accounts that ruin your email delivery rate.
Here’s how common list-building methods affect your email delivery rate:
- Popups and signup forms: Visitors willingly share their email addresses. This leads to fewer spam complaints and a healthier email list.
- Giveaways and contests: These attract freebie seekers. Visitors may use fake or temporary addresses just to win a prize, leaving you with an inactive list.
- Purchased lists: This is the highest-risk method. These lists often contain spam traps and fake emails, which trigger spam filters and damage your reputation.
Using double opt-in is the best way to protect your ecommerce email delivery rate. That’s because subscribers confirm their email addresses before joining your list.
What does the email delivery rate mean for ecommerce brands specifically
Ecommerce store owners face unique email delivery rate challenges compared to B2B businesses that send occasional newsletters.
Seasonal volume spikes are the biggest risk. Sending five times your usual volume around Black Friday or Cyber Monday looks suspicious to mailbox providers. You must intentionally warm up your email domain by slowly increasing your volume over several weeks before big holiday sales.
Most ecommerce brands also send a mix of transactional, promotional, and automated emails. Each type affects email delivery rate differently. So, tracking a single combined email delivery rate can mask issues. You should monitor these email types separately to get a more accurate view of your performance.
Apple Mail Privacy Protection (MPP) adds another layer of complexity. The average ecommerce email open rate sits at 18.3% in 2026 — but MPP can inflate that figure by four to eight percentage points, making open rates unreliable for list hygiene decisions:
Instead of cleaning your list based on opens, use clicks and conversions as your signal. A subscriber who never clicks is a deliverability risk regardless of whether MPP records them as an opener.
Omnisend tracks performance by campaign type and real engagement — giving ecommerce brands a clearer view of delivery rate across transactional, promotional, and automated sends, especially during peak seasons.
What to do when your email delivery rate drops: A diagnostic checklist
When your email delivery rate suddenly drops, following a structured diagnostic process can help you quickly identify the cause.
Use this checklist when your email delivery rate falls below your normal range:
1. Review your bounce report
2. Verify your email authentication
3. Audit recent list growth
4. Compare engagement by email type
5. Run a blocklist check
1. Check your bounce report: First, you need to separate permanent bounces from temporary ones. Then look for clues in your dashboard tied to specific sales, email signup sources, or lists you just added.
2. Audit your email authentication setup: Verify your SPF, DKIM, and DMARC settings are configured correctly using free tools like MX Toolbox. You must use Google Postmaster Tools to monitor your exact spam complaint rates and domain reputation.
3. Review recent list growth for unusual activity: Keep an eye out for unusual spikes in signups from unverified email-capture forms, purchased lists, or contests. Fake addresses can increase bounces and spam complaints, hurting your email delivery rate.
4. Analyze engagement trends by campaign type: Compare your promotional campaigns against automation flows and transactional emails. If one category suddenly performs poorly, you can isolate the issue faster.
5. Check blocklist status: Use a tool such as Spamhaus to check whether your sending domain or IP shows up on major email blacklists. A listing can harm both your email delivery rate and inbox placement.
How to improve your email delivery rate
Improving your email delivery rate requires consistent habits, rather than one-time fixes. Even the tiniest changes in list hygiene, sending practices, and monitoring can make a huge difference in the long run.
Here are some practical ways to strengthen your email delivery rate:
- Clean your list regularly: Remove hard bounces immediately and suppress subscribers who stay inactive for over 90 days. Usually, a smaller, healthier list performs better than a larger list filled with old or invalid contacts.
- Run re-engagement campaigns: Send a brief “We miss you” email to inactive subscribers before deleting them. If they still don’t open, click, or buy after a few tries, let them go to protect your email delivery rate.
- Maintain a consistent sending schedule: Avoid sudden, random jumps in your sending volume and habits. Stick to a predictable routine instead, so mailbox providers trust your patterns.
- Use a reputable ecommerce ESP: Choose a trusted email platform with strong sending infrastructure and reputation monitoring. Omnisend is recognized as one of the leading platforms for ecommerce email deliverability features.
- Monitor your email delivery rate: Review it regularly alongside bounce rates, spam complaints, clicks, and conversions. Watching trends over time helps you spot hiccups early, before they affect your sales.
How to track your email delivery rate in Omnisend
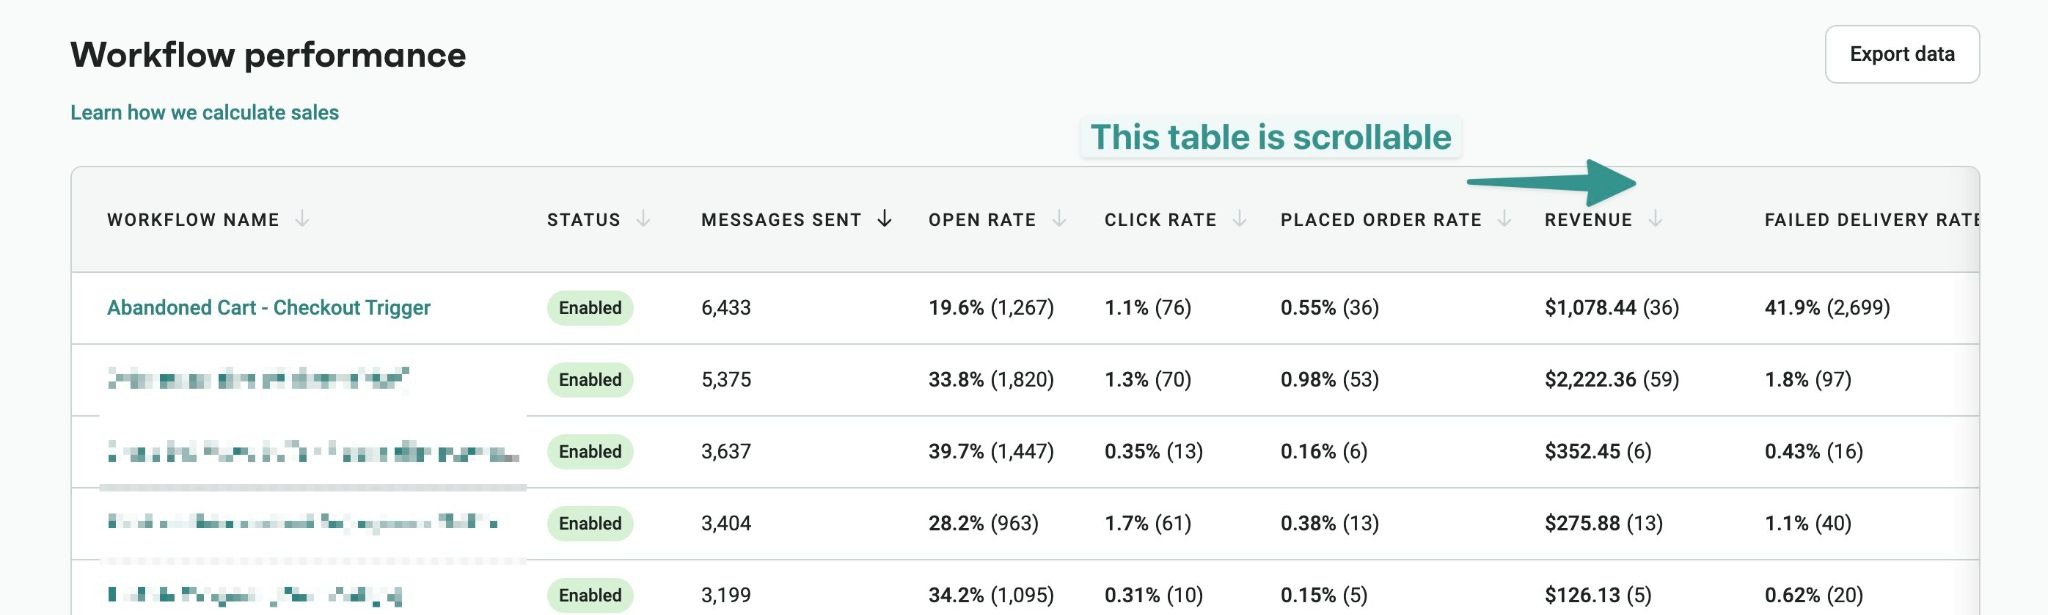
Monitoring your email delivery rate in Omnisend is straightforward. Just log in to your account and head straight over to the Reports tab. From there, click Campaigns or Automation, depending on the exact messages you want to check.
Inside the clean and user-friendly analytics dashboard, you’ll find your email delivery data. It sits right alongside open rates, click-through rates, orders, and attributed revenue. This view makes it easy to understand how many emails reached inboxes successfully versus how many failed to deliver:
Omnisend also helps ecommerce brands manage authentication and deliverability monitoring from one platform. This explains why the platform is recognized as a global leader in EmailTooltester’s 2026 report. It scored 4.5 out of 5 stars for its email deliverability features.
Conclusion
Your email delivery rate indicates whether receiving servers accepted your emails, but doesn’t confirm they arrived in recipients’ inboxes. Check both your deliverability and delivery rate to understand your email performance better.
Hitting an email delivery rate of 98% or higher is a great starting point for online stores. However, getting your messages into the inbox is the ultimate goal. By cleaning your list often, setting up authentication correctly, and using a trusted ESP, you can maintain healthy email delivery and deliverability rates.
Ecommerce brands face extra pressure due to seasonal spikes in sending and the mix of campaign types. This means you should consistently track performance before problems occur, rather than fix a broken reputation later.
Secure your spot in the inbox with Omnisend’s email delivery rate and deliverability tracking tools
Quick sign up | No credit card required
FAQ
What is a good delivery rate for email?
A good email delivery rate sits between 95% and 99% for most online ecommerce stores. Anything below 90% signals a list or reputation issue that needs attention.
How do you calculate email delivery rate?
You can get your email delivery rate using this simple formula:
- (Emails sent – bounced emails) ÷ emails sent × 100
What is the difference between email delivery rate and email deliverability?
Email delivery rate measures the percentage of emails accepted by the recipient’s mail server. Deliverability tracks whether accepted emails landed in the inbox folder or the spam folder.
What is the 30/30/50 rule for cold emails?
This framework splits email effort into three parts — 30% on subject lines, 30% on deliverability, and 50% on follow-ups. The logic is that consistent follow-up drives more results than any single send.
What is the 60/40 rule in email?
This design framework states that your emails should contain 60% text content and 40% images. Maintaining this balance prevents spam filters from blocking your messages and protects your email delivery rate.
What causes the email delivery rate to drop suddenly?
A sudden drop in email delivery rate often stems from list quality issues, authentication errors, and spam complaints. Increasing your sending volume and landing on email blacklists also impacts delivery.
TABLE OF CONTENTS
TABLE OF CONTENTS

Subscribe and don’t miss any updates!
No fluff, no spam, no corporate filler. Just a friendly letter, twice a month.