
 OFFER
OFFER


Email marketing
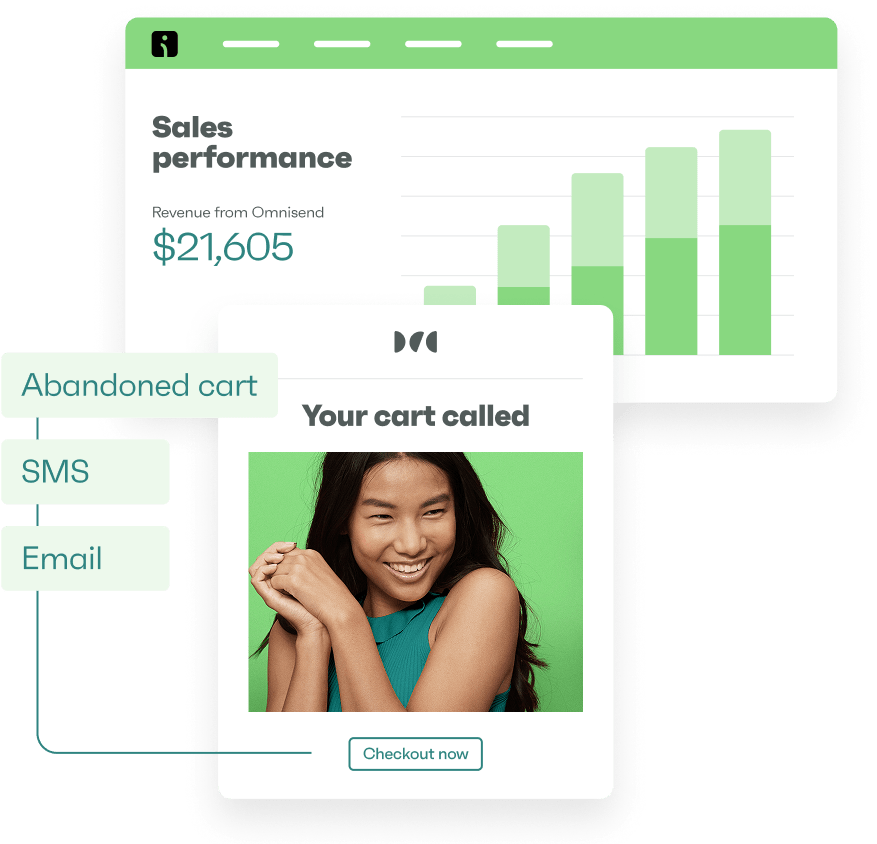
Drive sales on autopilot with ecommerce-focused features
See FeaturesAn email marketing report measures campaign and automation performance across opens, clicks, and revenue, helping you identify what generates sales versus what wastes budget. Without reports, you’re guessing at effectiveness.
Reports expose problems quickly. Low open rates mean deliverability issues, while high unsubscribes after promotions indicate pricing misalignment. Data replaces assumptions with measurable campaign improvements.
Join us below to understand email marketing analytics and learn which metrics matter, benchmark against industry standards, and spot revenue opportunities in your data.
Track email performance, revenue attribution, and optimize campaigns with Omnisend’s built-in analytics
Quick sign up | No credit card required
Why email marketing reporting and analytics matter
Without email reporting, you’re sending blind. You won’t know if campaigns reach inboxes, get opened, or generate revenue, making every send an expensive guess.
Statista predicts that global email users will reach 4.6 billion by 2025, adding 600 million new inboxes since 2020. Reports are the best way to reach these users profitably, showing which segments buy versus which don’t engage.
Reveal bottlenecks in your marketing
Reports expose the gap between what you think works and what drives revenue. A campaign with 40% opens but 2% clicks has compelling subject lines but weak content. High unsubscribes after discount emails suggest your audience expects different offers.
Uncover hidden revenue
Omnisend’s 2025 Ecommerce Marketing Report shows that automated emails drove 37% of sales from just 2% of email volume. Email reports help you spot your most significant opportunities to pivot towards flows that increase sales.
Track returns on investment
Omnisend’s Sales tab breaks down revenue by source, showing how much comes from email versus other channels. You’ll see which campaigns generate profit and which lose money, revealing your true marketing ROI beyond industry averages.
Protect your sender reputation
High spam complaints from one poorly targeted campaign can reduce inbox placement for all future sends. Reports show when bounce rates spike or engagement plummets. You need these warning signs to adjust your strategy before Gmail and Yahoo filter your emails as spam.
“Email marketing by Omnisend averages $76 per dollar spent, but your results vary by campaign type. An email marketing tool that attributes revenue to multiple channels helps you stop wasting budget on campaigns that don’t convert and double down on those that do.”
— Evaldas Mockus, VP of Growth at Omnisend
Key email metrics to track in your report
You need visibility across all performance indicators since one weak metric can undermine your entire email program, even if others look healthy. Watch for these metrics:
- Open rate: The percentage of recipients who opened your email. Subject line A/B testing will help increase your open rate.
- Click-through rate (CTR): Total clicks divided by total sends. Opens mean nothing if nobody clicks — this metric separates curiosity from genuine interest.
- Click-to-open rate (CTOR): Your content quality score. A 5% CTOR means 95% of openers found nothing worth clicking, wasting their time and your money.
- Bounce rate: Invalid addresses that reject your emails. Each bounce damages your sender reputation, affecting whether future emails reach the inbox.
- Unsubscribe rate: The brutal truth about your relevance. Every unsubscribe represents lost future revenue and a vote against your messaging.
- Conversion rate: Orders divided by delivered emails. The gap between clicks and conversions exposes checkout friction or pricing disconnect.
- Spam complaint rate: Your reputation killer. Inbox providers share complaint data, so one bad campaign affects deliverability everywhere.
- Revenue per email: Total sales attributed divided by sends. Helps strip away engagement theater to show what each campaign earns.
- Mobile vs desktop performance: Where your audience engages. Mobile-first isn’t universal — B2B buyers often purchase during desktop work hours.
- List growth trends/net new subscribers: New subscribers minus losses. Shrinking lists force higher conversion rates to maintain revenue levels.
Omnisend’s reporting dashboard tracks all these metrics automatically, updating live as campaigns run, orders happen, and subscribers engage — no manual calculations or spreadsheet exports needed.
Watch this video to learn more about Omnisend’s metrics and email reporting:
How to analyze email campaign performance
Follow these six steps for email campaign analysis in Omnisend:
Step 1 — Review campaign results in the reporting dashboard
Open Omnisend and head to Reports, then click Campaigns. Every metric updates live as orders are processed, giving you current performance data without waiting for overnight updates:
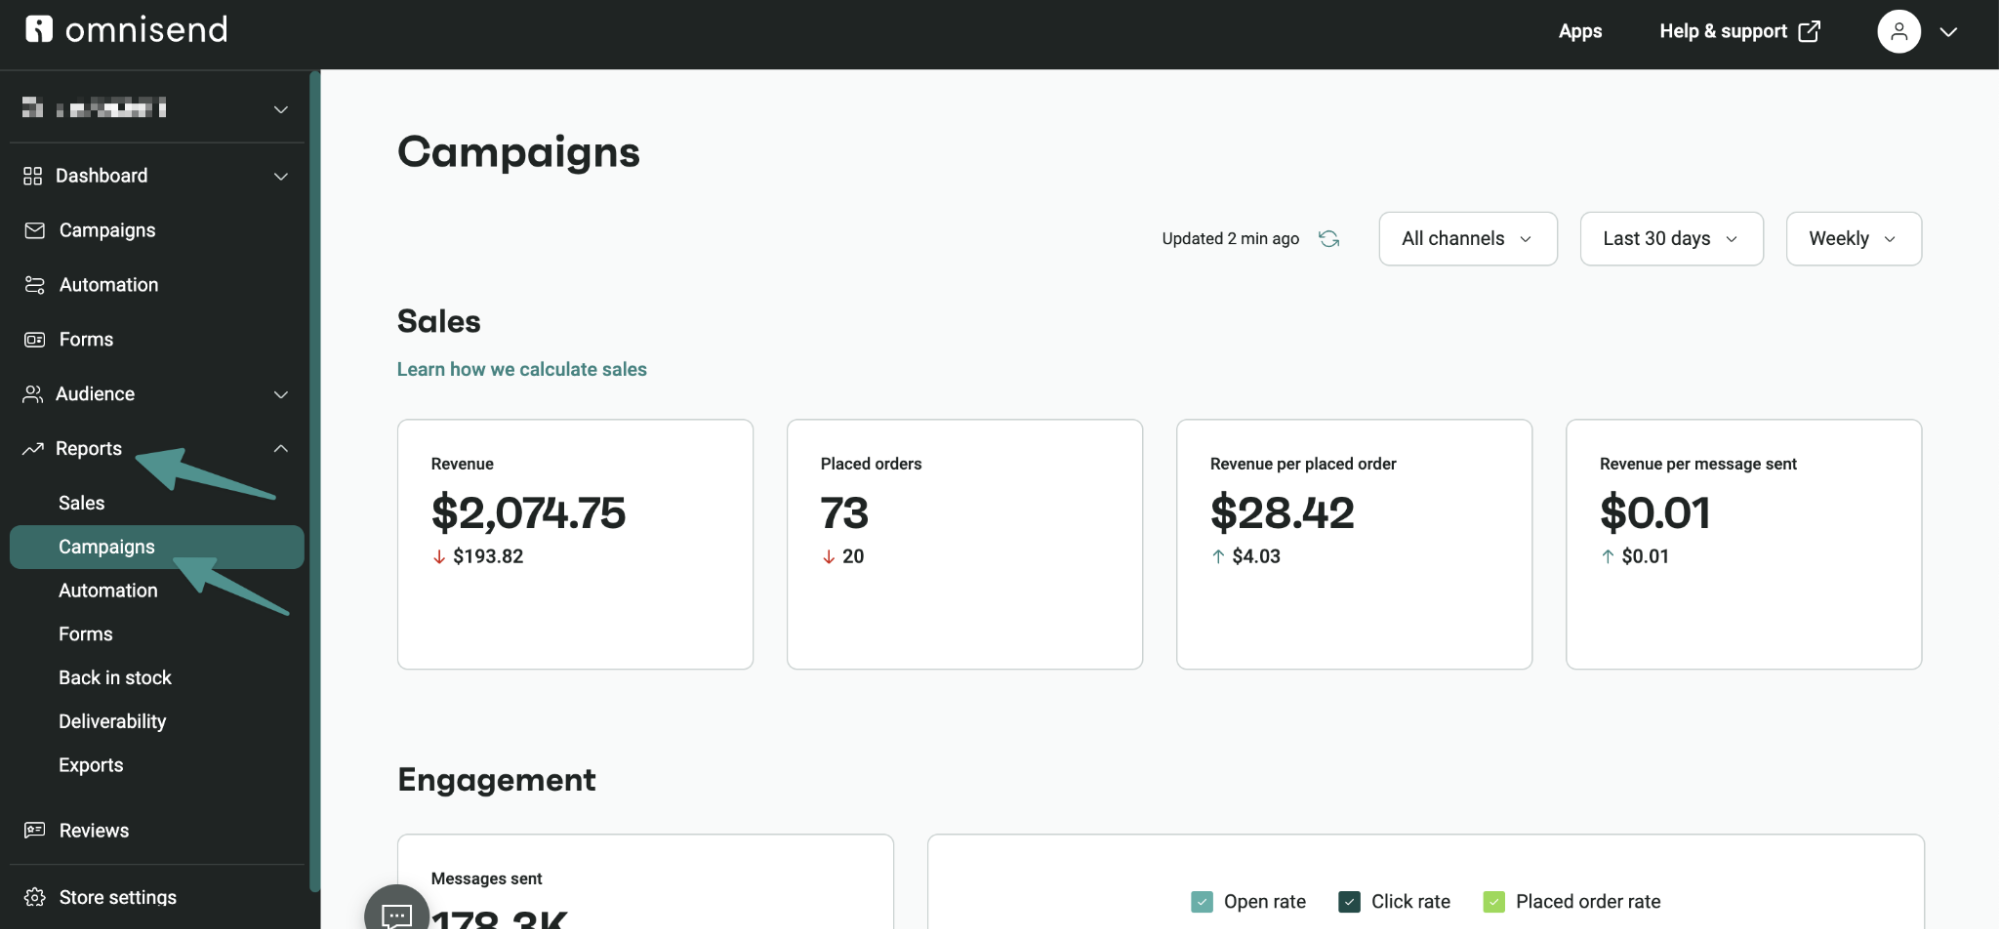
Use these filters to explore your email campaign reports:
- Channel Selector: Filter by email, SMS, or push to see which increases revenue versus draining budget
- Date Range: Compare Black Friday to regular weeks or track performance changes after major strategy shifts
- Time Granularity: Daily views catch immediate problems while monthly views reveal gradual deliverability decay or audience fatigue
Step 2 — Compare performance across different audiences, segments, and channels
Segment comparison reveals which customer groups create revenue versus those costing money. VIP customers might show 40% open rates while new subscribers barely hit 15%.
Use these insights to adjust send frequency by segment value. High-performing segments deserve more attention, while underperformers need different content approaches or reduced sending to prevent unsubscribes.
Step 3 — Track trends over time
Watch for gradual shifts that single email marketing reports miss. Open rates dropping from 25% to 20% over three months means you’re heading toward spam folders. Rising unsubscribes after promotional emails reveal pricing fatigue or offer misalignment.
Omnisend’s Pro plan includes Channel Trends as part of its Advanced Reports feature, showing multiple graphs over custom date ranges:
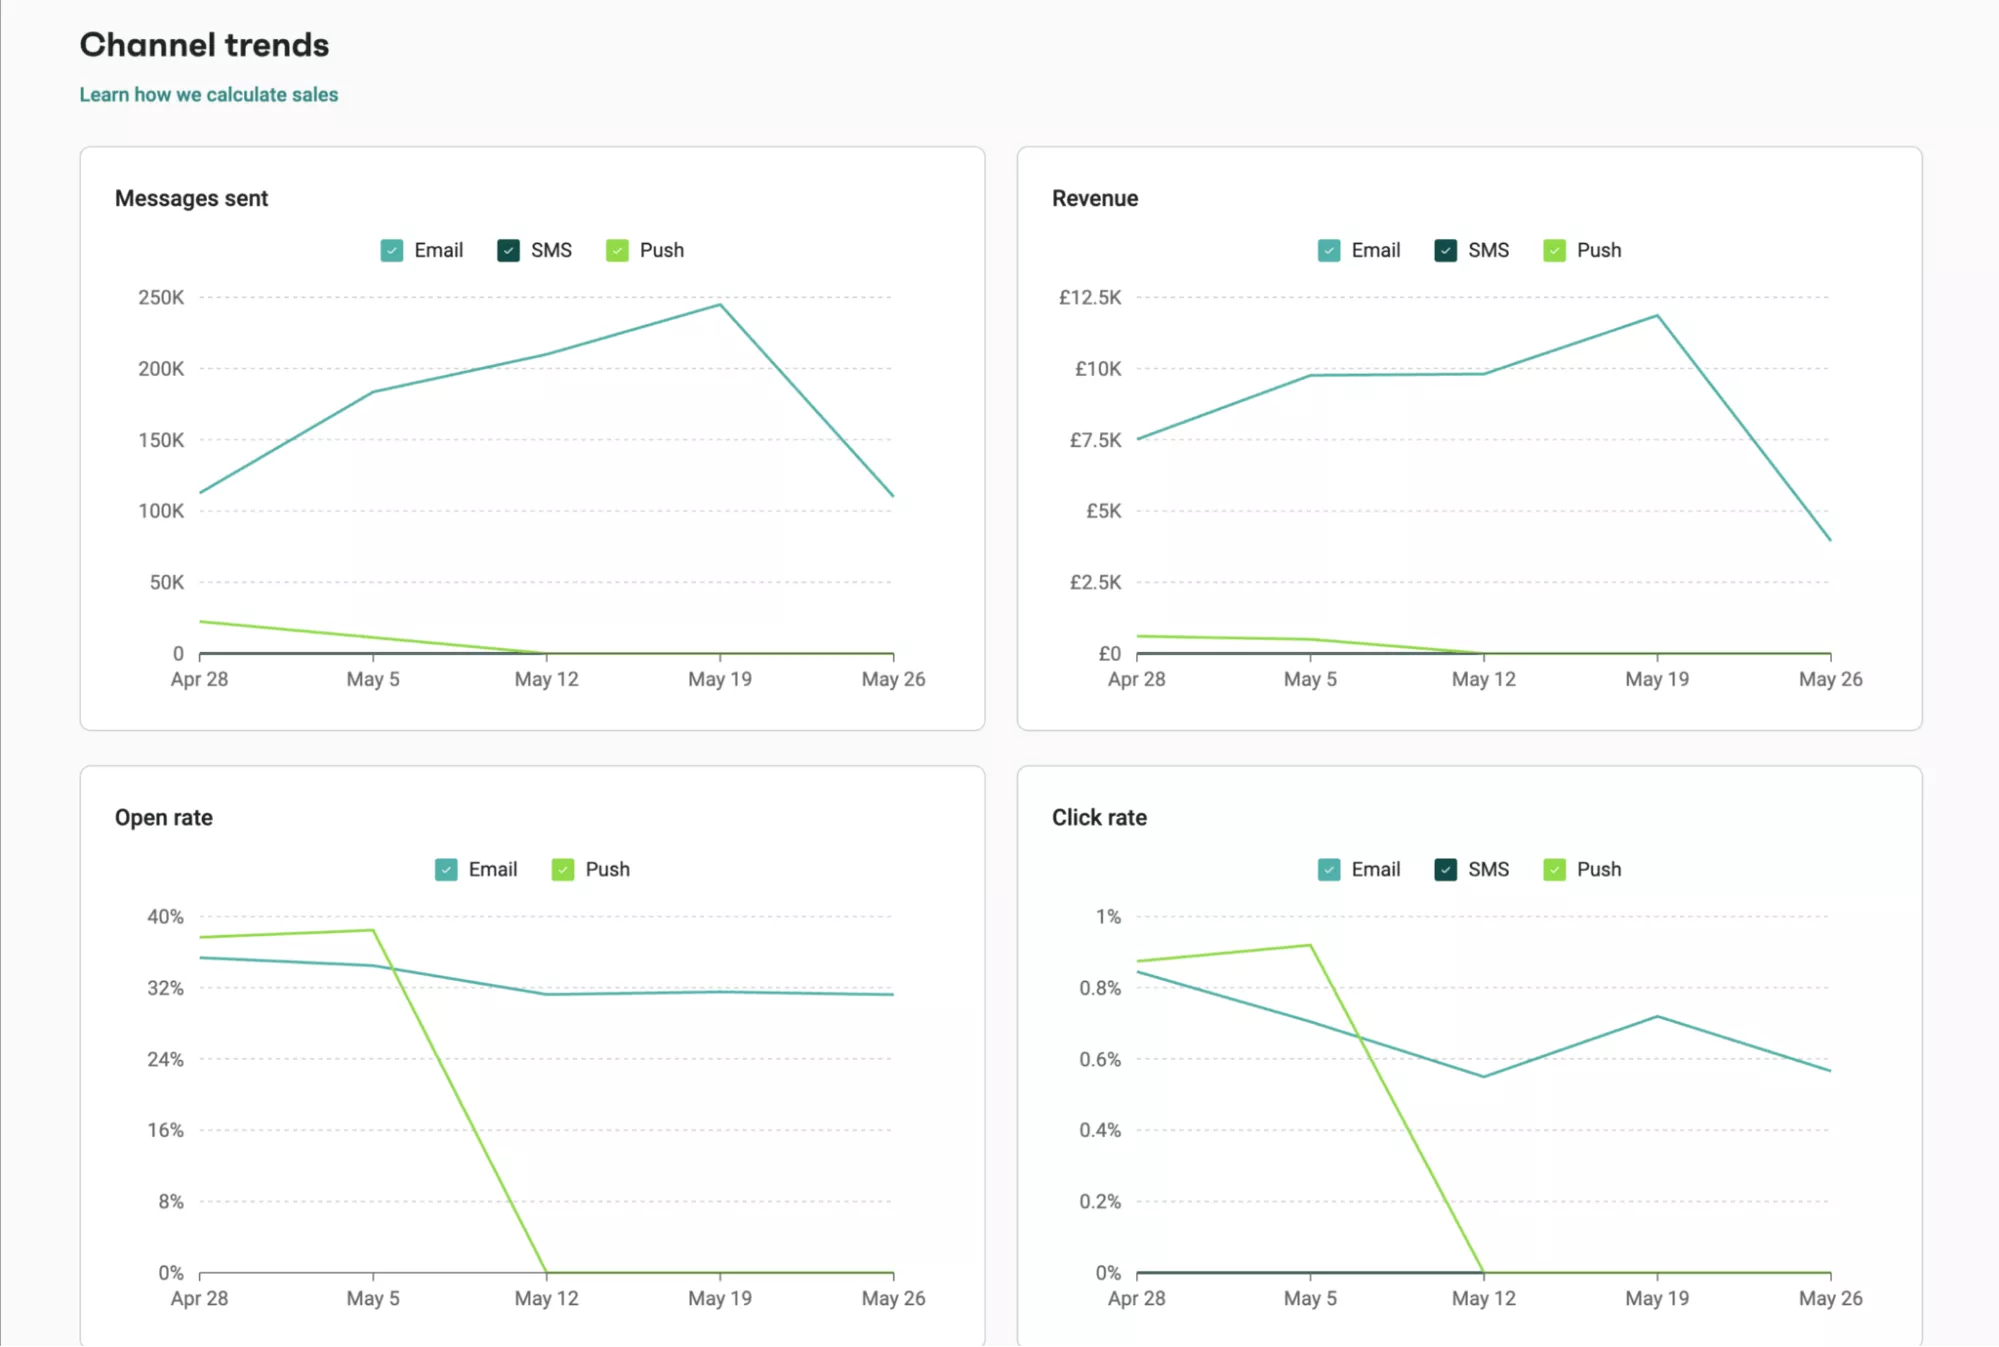
Weekly monitoring catches these warning signs early. A 5% open rate decline fixed today prevents landing in spam tomorrow, where recovery takes months of reputation rebuilding.
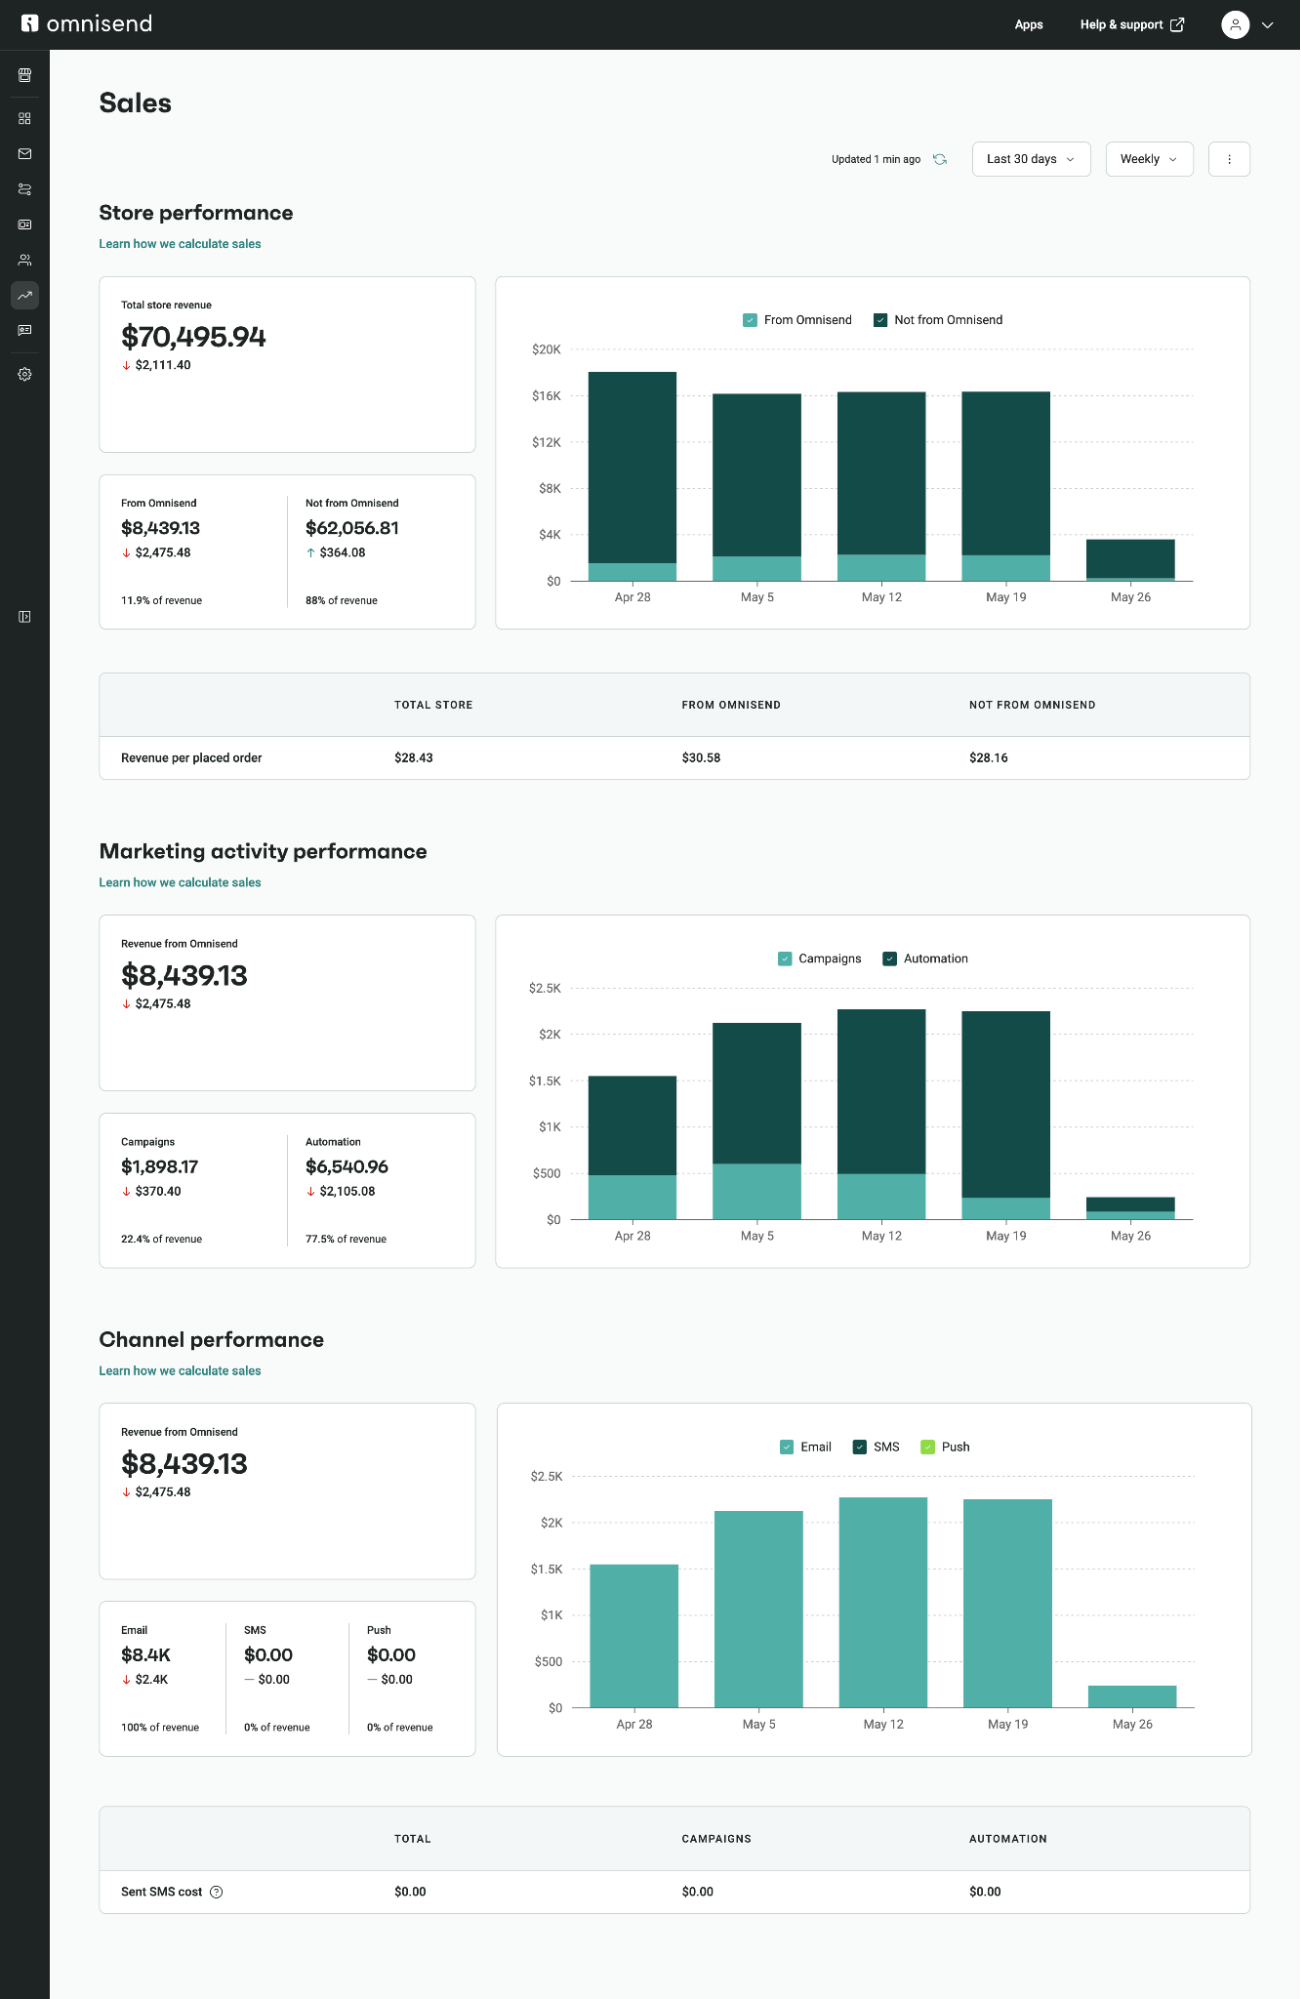
Step 4 — Use revenue attribution to understand what drives sales
Revenue attribution connects every dollar to its source campaign. Product launches might generate buzz, but abandoned cart emails could generate twice the revenue.
Attribution data reshapes budget allocation decisions. Why spend on flashy campaigns when automated flows quietly generate most sales with minimal ongoing effort or cost?
This screenshot shows the depth of revenue attribution that Omnisend collects:
Step 5 — Monitor device breakdown and optimize design accordingly
Device reports show where customers read versus where they buy. Mobile dominates opens, but desktop might account for 80% of revenue for B2B brands.
Design priorities become clear with this data. Mobile-optimized templates matter less if your audience consistently purchases during desktop work hours rather than browsing on phones.
Step 6 — Identify your top and worst-performing campaigns
Sort campaigns by revenue per email to find hidden winners and expensive failures. That “boring” product update might outperform your biggest sale announcement.
Bottom performers need immediate attention. Every send to unengaged segments could damage your sender reputation as people unsubscribe and add you to their junk folder. Also, unengaged segments will eat into your send and contact limits without any benefit.
Benchmarks and email performance examples
Industry benchmarks provide context for your performance, but your actual results depend on audience quality, content relevance, and sending frequency.
The most interesting result from our global benchmarks is that automations outperform campaigns by a significant margin.
Check out these benchmarks for campaigns and automations:
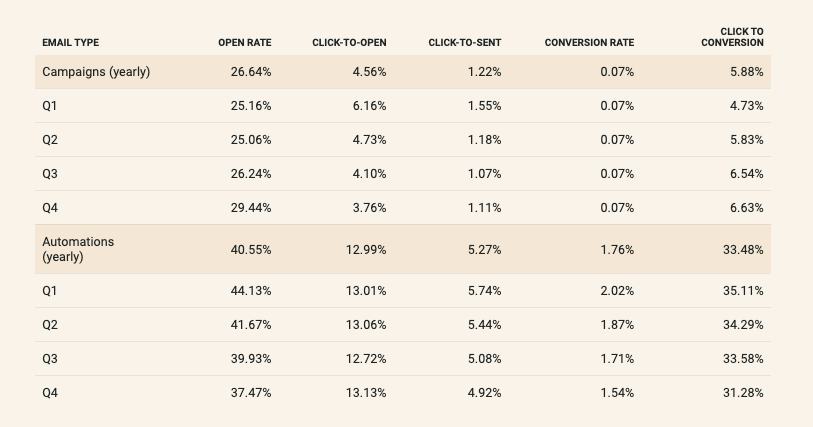
The data above proves that automated flows outperform manual campaigns, and it isn’t even close, with open rates jumping 52%, clicks soaring 332%, and conversions sitting 2,361% higher.
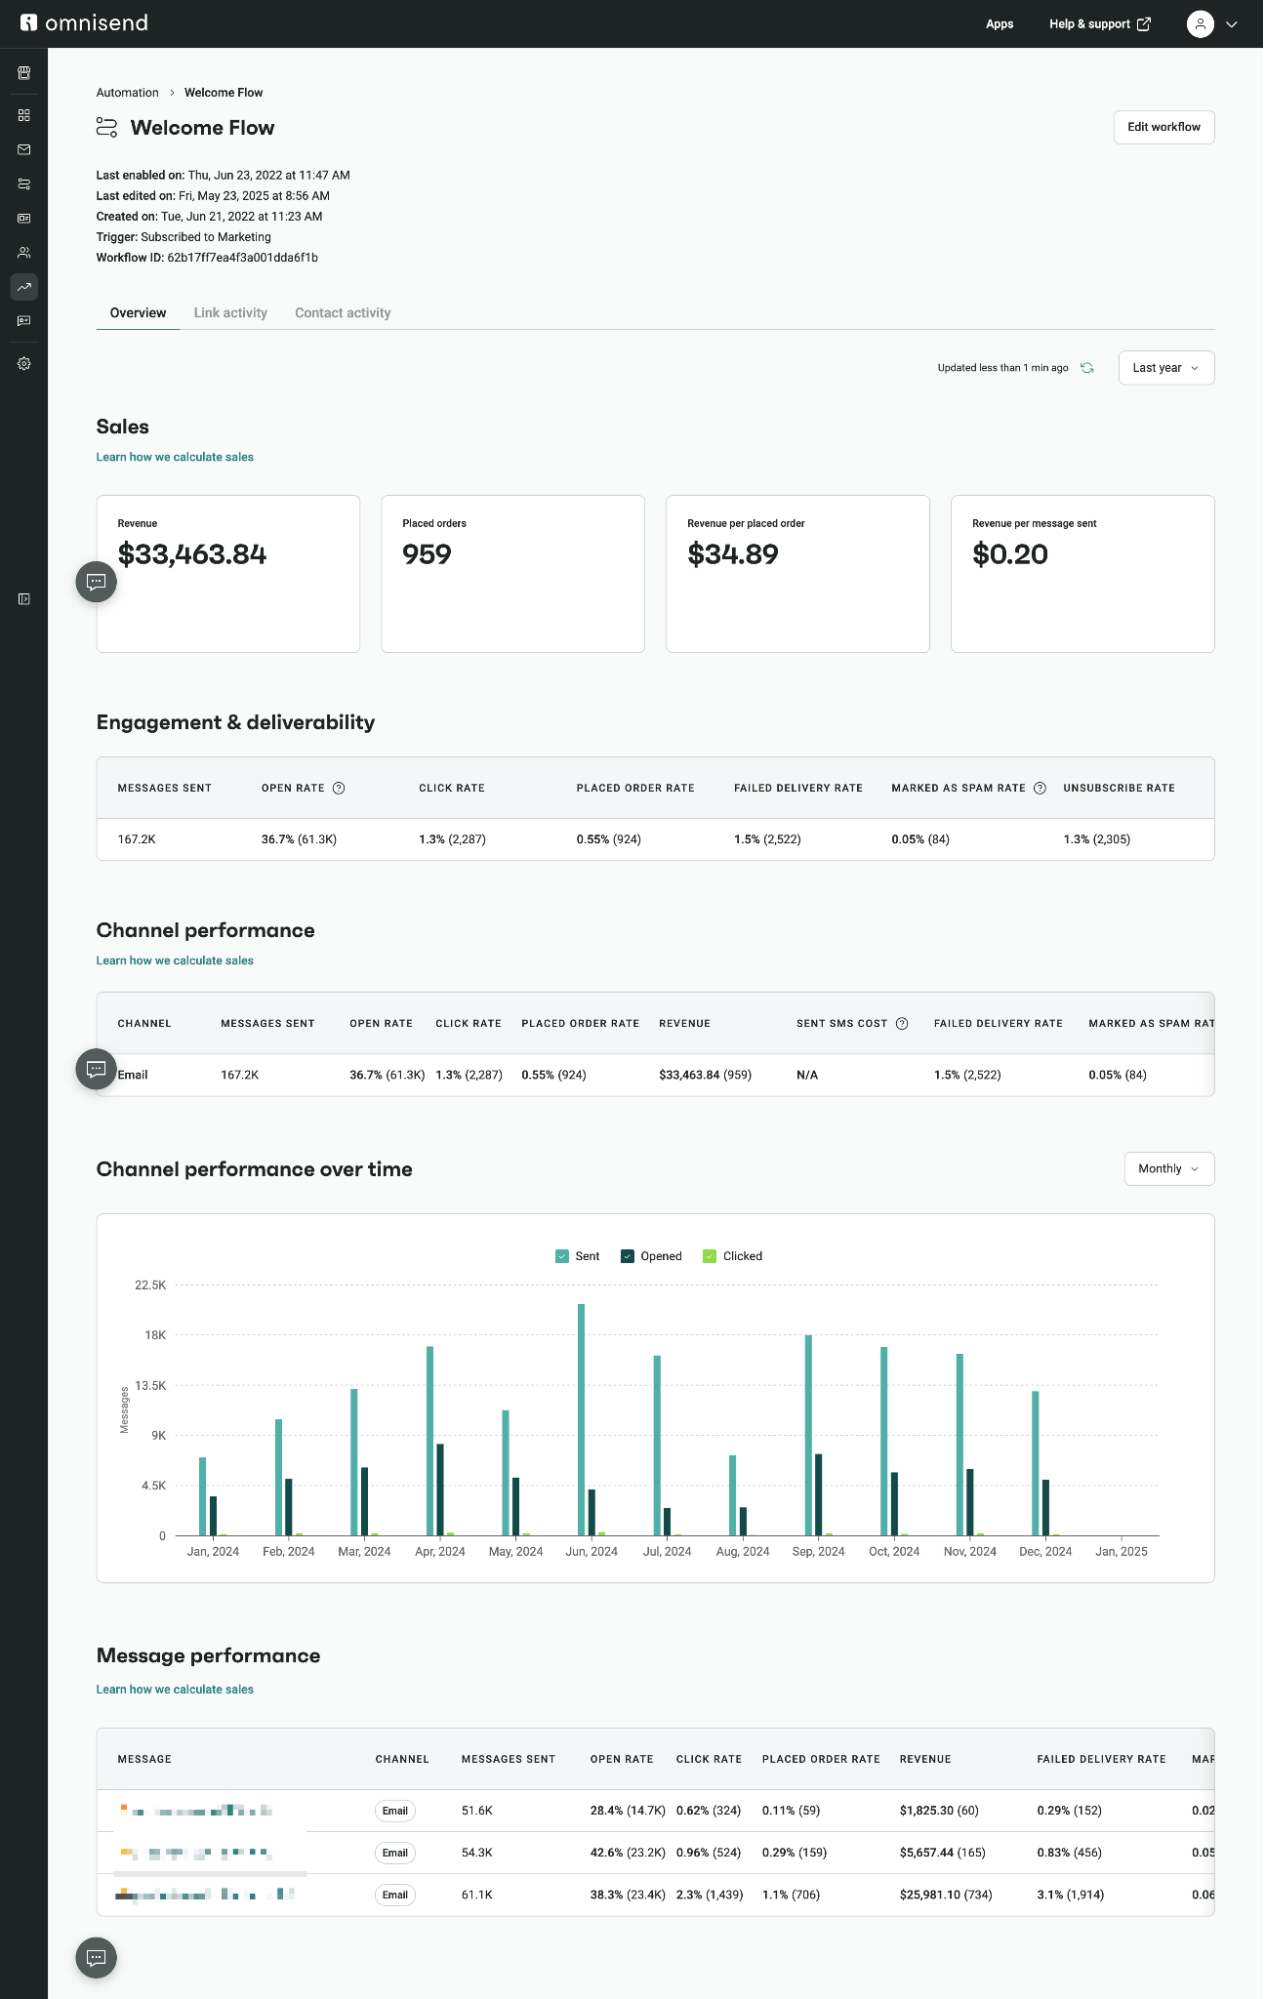
Omnisend helps you understand your automation performance with Individual Workflow Reports, which provide a granular view of sales and performance over time. Here’s a screenshot of a Welcome Flow report:
Current email performance standards
- 26.6% of emails got opened globally in 2024, marking four straight years of growth per Omnisend’s data
- Click rates fell from 1.49% to 1.22%, but here’s the twist — those fewer clicks converted 27.6% more often
- Promotional campaigns typically lose 0.5% to 1% of subscribers per send based on internal Omnisend data
Remember, these benchmarks shift constantly. What matters most is beating your previous performance and understanding why some campaigns outperform others.
La Machine Cycle Club achieves 64% open rates and 7% click rates on automation emails. It triggers them around major cycling events and gives loyal subscribers exclusive discounts during Black Friday.
Read the case study here.
Email marketing report templates and dashboards
Your email marketing report should cover revenue generated per campaign, problems to fix, and next actions. Everything else is noise that obscures critical decisions.
Include these elements in your email marketing report template:
Executive summary
Three sentences capturing total revenue, top-performing campaigns, and primary issues needing attention for quick performance assessment.
KPI overview
Your five most important metrics on one page. Open rate, CTR, conversion rate, revenue, and unsubscribe rate tell the story fast.
List health metrics
New subscribers minus unsubscribes and bounces. Negative growth means you’re burning through your audience faster than you’re building it.
Revenue and conversion tracking
Which emails make money? Your Welcome series might drive 40% of revenue while sales announcements barely break even.
Campaign-by-campaign breakdown
Individual campaign performance sorted by revenue per email. Shows which message types and send times generate profits versus those that waste resources.
Segment-level insights
Performance split by customer type. First-time buyers need different messaging than VIPs who’ve purchased 20 times.
Omnisend’s dashboard automatically organizes these sections without spreadsheet exports or manual calculations. Advanced Reports, a feature in the Pro plan, go further with open rates, click rates, placed order rates, and revenue for all segments.
Here’s an email marketing report example — feel free to steal it, use it, and present it within your business. Just make sure to add your data and images:
Executive summary
[Placeholder — insert your content]
Reporting period: [Date range]
- Total revenue generated: $[Amount]
- Top performing campaign: [Campaign name] – $[Revenue]
- Primary issue: [Main problem requiring attention]
Key performance indicators
| Metric | This period | Previous period | Change |
|---|---|---|---|
| Open rate | _% | _% | +/-_% |
| Click-through rate | _% | _% | +/-_% |
| Conversion rate | _% | _% | +/-_% |
| Revenue per email | $_ | $_ | +/-$_ |
| Unsubscribe ate | _% | _% | +/-_% |
Revenue and conversion tracking
Revenue by campaign type
- Automated flows: $[Amount] ([X]% of total)
- Welcome series: $[Amount]
- Abandoned cart: $[Amount]
- Browse abandonment: $[Amount]
- Manual campaigns: $[Amount] ([X]% of total)
- Promotional: $[Amount]
- Educational: $[Amount]
- Product launch: $[Amount]
Top five revenue-generating campaigns
- [Campaign name] – $[Revenue] – [Revenue per email]
- [Campaign name] – $[Revenue] – [Revenue per email]
- [Campaign name] – $[Revenue] – [Revenue per email]
- [Campaign name] – $[Revenue] – [Revenue per email]
- [Campaign name] – $[Revenue] – [Revenue per email]
List health metrics
| Metric | Count | Change |
|---|---|---|
| Total subscribers | [Number] | +/-[Number] |
| New subscribers | [Number] | +/-[Number] |
| Unsubscribes | [Number] | +/-[Number] |
| Hard bounces | [Number] | +/-[Number] |
| Net growth | [Number] | +/-[Number] |
Segment performance
| Segment | Size | Open rate | CTR | Revenue | Rev/email |
|---|---|---|---|---|---|
| VIP customers | [Number] | _% | _% | $[Amount] | $_ |
| New subscribers | [Number] | _% | _% | $[Amount] | $_ |
| Inactive | [Number] | _% | _% | $[Amount] | $_ |
| [Custom segment] | [Number] | _% | _% | $[Amount] | $_ |
Device performance
| Device | Opens | Clicks | Orders | Revenue |
|---|---|---|---|---|
| Mobile | _% | _% | _% | $[Amount] |
| Desktop | _% | _% | _% | $[Amount] |
| Tablet | _% | _% | _% | $[Amount] |
Problem areas requiring action
Immediate issues
- [Issue 1]: [Description and impact]
- Action: [What to do]
- [Issue 2]: [Description and impact]
- Action: [What to do]
Performance trends
- Declining metric: [Metric] down _% over [timeframe]
- Improving metric: [Metric] up _% over [timeframe]
Recommendations
- Quick wins
- [Action item with expected impact]
- [Action item with expected impact]
- Strategic changes
- [Longer-term improvement with rationale]
- [Longer-term improvement with rationale]
- Testing priorities
- [What to A/B test next]
- [Segment to focus on]
How to use insights from your email reports
Email performance data without action wastes everyone’s time. Here’s how to fix common problems your reports reveal:
Low click rates despite good opens
Your subject line delivers, but the content disappoints. Replace text links with contrasting buttons. Position your CTA above the fold. Cut the copy length and add concise headings that get your point across sooner.
High clicks, poor conversions
Emails work, landing pages don’t. Check for price mismatches between email and site, broken mobile checkout, slow page load times, or high shipping costs that appear only at checkout and shock buyers away.
New subscribers aren’t buying
They don’t know you yet. New subscribers need proof you’re worth their money — customer reviews, bestseller lists, or return policies. Your welcome series should build confidence, not just push products.
Unsubscribe rates spike
Find the trigger behind the spike. Sort campaigns by unsubscribe rate to identify problem emails. A 3% unsubscribe spike might mean you promoted the wrong product, sent it at a bad time, or hit a nerve with messaging.
Decent email metrics but flat revenue
You’re emailing the wrong people, or your offers aren’t good enough. VIP customers need exclusive offers, while new subscribers need education. Segment your list based on purchase history and send customers personalized content.
Mobile opens dominate, but desktop drives revenue
Your emails look great on phones, but checkout fails there. Test the complete purchase flow on mobile or add “best viewed on desktop” for complex products. Create a one-page checkout and let people pay with Google and Apple Pay to make buying faster.
Wrap up — track smarter, grow faster
Email metrics work together — opens show deliverability, clicks reveal content quality, and conversions prove everything aligned. But revenue per email connects all these dots to actual profit, not just activity.
Track the complete journey from inbox to purchase. Know which segments spend, which automations convert, and why some campaigns generate 10 times more revenue than others despite similar open rates.
Omnisend automates this email marketing tracking without spreadsheet exports or manual calculations. Your dashboard shows what drives revenue, what needs fixing, and where to focus next. Data drives decisions, not guesswork.
Join Omnisend to track every email open, click, and sale with revenue attribution per channel
Quick sign up | No credit card required
FAQs
What is an email marketing report?
A breakdown of campaign performance tracking open rates, clicks, conversions, and revenue. It shows which emails make money versus those that are wasting budget.
What is included in a good email campaign report?
Revenue per email, engagement rates by segment, device breakdowns, deliverability warnings, and trend comparisons. Essential data for killing bad campaigns and scaling winners.
What are the 5 T’s of email marketing?
Target the right people, Time sends correctly, Template for readability, Test everything constantly, and Track results obsessively. Miss one T and campaigns fail.
What are the 4 P’s of email marketing?
Permission to send, Personalization that matters, Performance that reaches inboxes, and Profit from every campaign. It’s an old-school framework that still applies to modern email strategy.
TABLE OF CONTENTS
TABLE OF CONTENTS

Subscribe and don’t miss any updates!
No fluff, no spam, no corporate filler. Just a friendly letter, twice a month.