
 OFFER
OFFER


Drive sales on autopilot with ecommerce-focused features
See FeaturesKey takeaways 
The average email popup conversion rate in 2025 is 2.1%, with benchmarks indicating that rates below 1.5% are underperforming, while 5% and above are considered excellent.
Gamified popups, like Wheel of Fortune, significantly outperform traditional formats, achieving conversion rates of 3.5% or higher, making them a top strategy for rapid list growth.
Timing is crucial for popups; a delay of 6-10 seconds yields the best conversion rates, while immediate displays tend to underperform.
Mobile optimization is essential, as popups designed for mobile devices convert at 2.2%, compared to just 1.4% for desktop-only popups, highlighting the importance of reaching modern shoppers effectively.
Reveal key takeaways
Popup statistics from 1.24 billion displays show the average email popup conversion rate in 2025 is 2.1% — but “good” depends on context, not a single magic number. As a practical benchmark, below 1.5% is usually underperforming, 1.5–3% is average, 3–5% is good, and 5%+ is excellent. If your goal is to beat the baseline fast, the data also shows that gamified formats like Wheel of Fortune can reach 3.5%+ conversion rates.
In the sections ahead, we’ll define email popup best practices in performance terms, then unpack the biggest levers behind conversion rate: timing and delay, triggers like exit intent, number of fields, mobile vs desktop targeting, incentives, and segmentation.
We also recommend zooming out with context from Omnisend’s latest ecommerce marketing report to help you interpret these benchmarks based on how shoppers behave now — and what that implies for 2026.
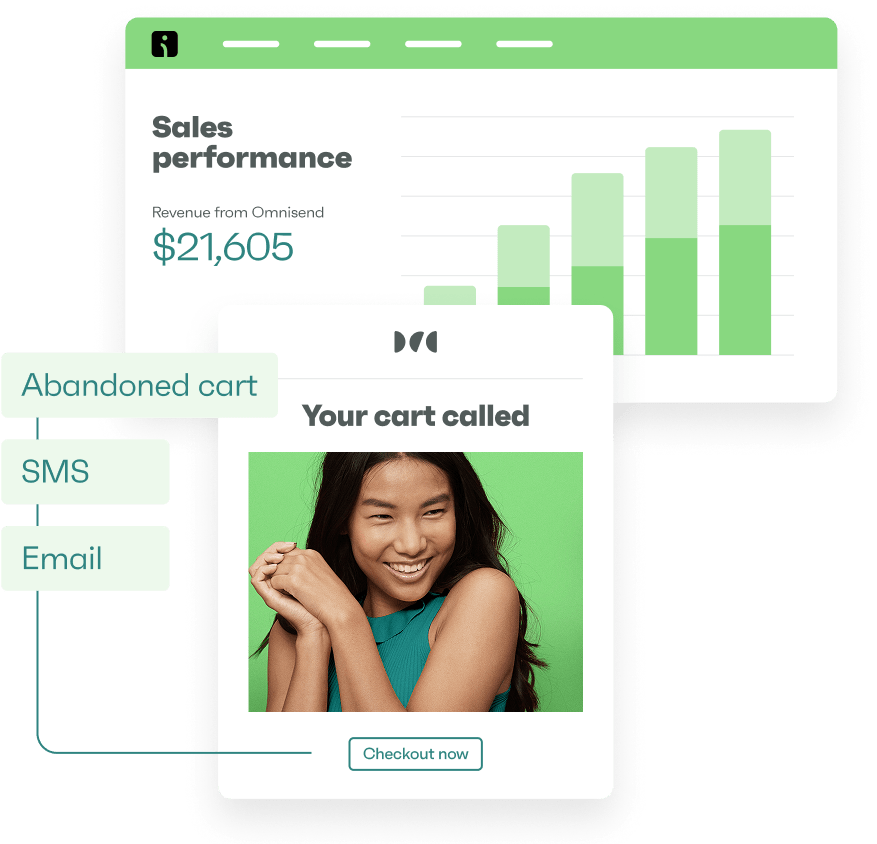
Automate Shopify email and SMS marketing with Omnisend
Quick sign up | No credit card required
Email popup statistics and trends for 2026
If you’re benchmarking list growth, these popup results provide a clear snapshot of where email capture stands right now — and what that momentum suggests heading into 2026.
Across the dataset, popup usage kept climbing fast, while conversion rate dipped slightly. That combination matters: it means more brands are leaning on popups as a standard acquisition lever, but squeezing out “extra” conversion now depends more on optimization than on simply adding a form.
2025 popup performance snapshot (vs. 2024)
Total displays: 1.24B (+54% YoY from 803M)
Total emails collected: 26.4M (+44% YoY from 18.3M)
Average conversion rate: 2.1% (down slightly from 2.3%)
The big takeaway is scale. Popups were displayed far more often in 2025, and they collected far more emails overall — despite a small decline in average conversion rate. In practice, that usually points to two trends happening at the same time: (1) more stores are adopting popups (or showing them more aggressively), and (2) audiences are seeing more of them, which raises the bar for relevance, timing, and offer quality.
Methodology notes (what’s included in this dataset)
To keep these benchmarks meaningful and avoid skew from edge cases, the analysis focuses on popup-type forms only and applies a few filters:
- Popup forms only (not all on-site forms or sign-up sources)
- Excludes phishers, bad actors, and test accounts
- Includes only forms with at least 1,000 yearly views (to avoid tiny-sample noise)
- Excludes extreme 50%+ conversion outliers (to prevent unrealistic distortion)
If you want to compare popup conversion rates to the wider landscape (like email engagement and list growth benchmarks beyond popups), see our email marketing benchmarks and stats for additional context.
What is a good popup conversion rate in 2025?
Our popup statistics show the average email popup conversion rate in 2025 is 2.1%. That’s a useful baseline — but what counts as “good” depends on your popup type, audience, traffic source, offer, and how targeted the message is.
Here’s a simple benchmark you can use to quickly categorize performance:
- Below 1.5% = underperforming
- 1.5–3% = average
- 3–5% = good
- 5%+ = excellent
If you want a realistic “best-case” target, top performers who actively optimize timing, targeting, and format can reach 3.5%+ — especially with gamified popups like Wheel of Fortune, which naturally convert higher than a basic “join our newsletter” email capture.
It’s also worth noting that benchmarks vary widely across the industry. For example, Wisepops reports an average popup conversion rate around 4.65% (and highlights higher performance for some segments), OptiMonk cites 11.09%, and Popupsmart reports 3.49%. The gap doesn’t mean one dataset is “wrong” — it usually comes down to methodology differences, like which popup types are included, how “conversion” is defined, traffic quality, sample size, and whether outliers are filtered.
Browse these real email popup examples to see what high-performing formats look like in practice.
Popup conversion rates by form component: 2025 benchmarks
Once you’ve got your “good conversion rate” baseline, the next step is figuring out what to change to improve it. In this section, we’ll break down 2025 popup conversion rate benchmarks by individual form components — so you can see which design, targeting, and incentive choices are most strongly associated with higher signup rates.
Each subsection focuses on one variable at a time (format, visuals, timing, fields, device targeting, offers, triggers, and placement), with practical takeaways you can apply without overhauling your entire popup strategy.
Multi-step vs. single-step popups
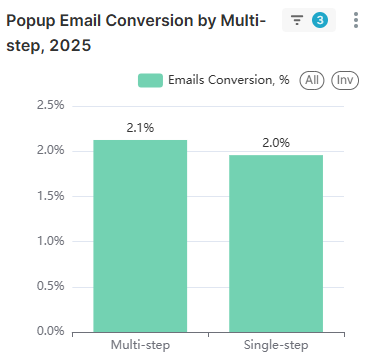
In 2025, multi-step popups converted at 2.3%, outperforming single-step popups at 2.0%. That may not sound dramatic, but at scale, a 0.3-point lift can translate into thousands of additional subscribers — without increasing traffic or showing your popup more aggressively.
The likely driver is the “foot-in-the-door” effect: once a visitor makes a small, low-friction commitment (like clicking “Yes, show me the offer” or choosing a preference), they’re more likely to follow through and submit their email. Multi-step flows also feel less intrusive because the first step doesn’t immediately ask for personal information.
What to do: add a simple qualifying question before the email field. For example, ask what they’re shopping for, pick a discount type, or select a category — then reveal the signup in step two. If you want an easy way to build and test these workflows, explore Omnisend’s popup builder and targeting options to create multi-step forms without custom development.
Image vs. no image
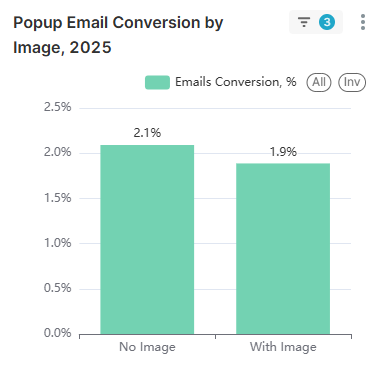
Popups that included an image converted at 2.2% in 2025, compared to 2.1% for popups with no image. In other words: visuals can help, but the lift is modest on average — more like a small edge than a magic lever.
Why the bump? Images add instant context and “pattern break” value. A clear product shot, a lifestyle image that matches the offer, or simple branded graphics can make the popup feel more intentional and less like an interruption. They can also reinforce trust cues (your brand style, recognizable products, a clean design), which may improve how visitors feel about the experience — even when conversion lift is small.
It’s also worth being realistic about big claims you’ll see elsewhere. Some brands report massive improvements from visuals (for example, Sleeknote has cited triple-digit gains), but those results often depend on what the image replaced, the audience, and the overall redesign. In our dataset, images helped — just not dramatically.
How A/B testing affects popup performance
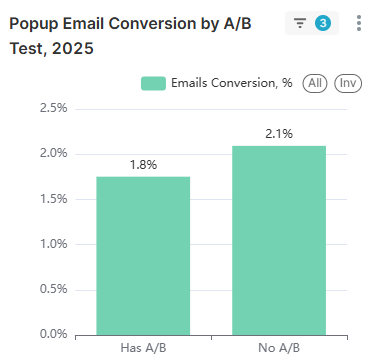
In our 2025 dataset, popups that used A/B testing averaged a 2.0% conversion rate, while popups with no A/B testing averaged 2.1%. At first glance, that looks backwards — shouldn’t testing improve results?
The key is how aggregate benchmarks work. A/B testing intentionally includes variants that won’t win. When you run tests, you’re splitting traffic between multiple versions (headline, offer, design, timing, fields), and at least one of those versions will underperform. Those “losing” variants still count in the dataset, which can pull down the overall average for the group that tests — even if the final outcome is a stronger, optimized popup.
What to do: don’t treat this benchmark as a reason to skip testing. The value of A/B testing isn’t the average while you’re experimenting — it’s the ability to identify the winning combination and then roll it out with confidence. If anything, this result is a reminder to test efficiently (one variable at a time) and apply the winner quickly.
How long should you delay popup display?
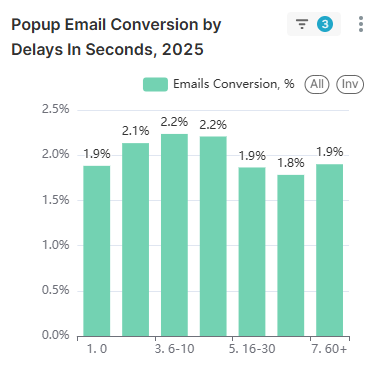
In 2025, timing made a clear difference in popup conversion rates — and the data points to a practical sweet spot. Popups shown immediately (0–1 seconds) converted at 1.9%, while giving visitors a brief moment to settle improved performance. The best results came from a 6–10 second delay, which reached 2.4% on average.
Here’s how conversion rate broke down by delay timing:
- 0–1 seconds: 1.9%
- 1–5 seconds: 2.3%
- 6–10 seconds: 2.4% ⭐(sweet spot!)
- 11–15 seconds: 2.1%
- 16–30 seconds: 1.9%
- 31–60 seconds: 1.8%
- 60+ seconds: 1.9%
Why does 6–10 seconds work best? It’s long enough for visitors to orient themselves—confirm they’re on the right site, scan a product or headline, and build a bit of intent. But after ~30 seconds, attention tends to shift: they’ve either moved deeper into browsing (and ignore interruptions) or they’re already on a path where a generic popup feels irrelevant.
What to do: start with a 6–10 second trigger as your default. Avoid instant popups (lower conversion and higher annoyance risk), and don’t rely on long delays beyond 30 seconds unless the popup is highly targeted to what the visitor is doing.
How many signup fields should you use?
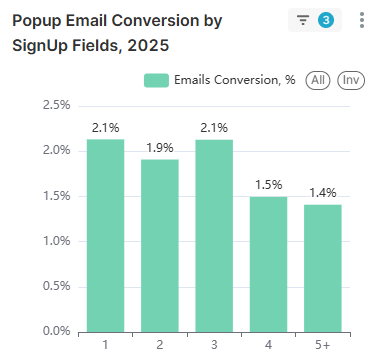
Field count is one of the simplest levers to control friction — and the 2025 benchmarks show a clear cutoff point. Popups with one to three fields performed almost the same, while four or more fields caused a sharp drop in conversion rate.
Here’s the breakdown:
- 1 field: 2.1%
- 2 fields: 2.2%
- 3 fields: 2.1%
- 4 fields: 1.5%
- 5+ fields: 1.4%
The practical insight: simplicity wins, but there’s flexibility. If you want to capture both name + email, you likely won’t pay a meaningful conversion penalty — two fields actually performed slightly higher than one in this dataset. Three fields also held steady. The steep decline starts at four fields, where the experience begins to feel like “work” rather than a quick signup.
What to do: keep your popup to 1–3 fields whenever possible. If you need additional data (birthday, product preferences, size, pet type, etc.), don’t cram it into the first view. Instead, use a multi-step popup: collect the email first, then ask one extra question in step two (or later via an email preference center) to keep conversion strong without sacrificing segmentation.
Device targeting: Where should your popup appear?
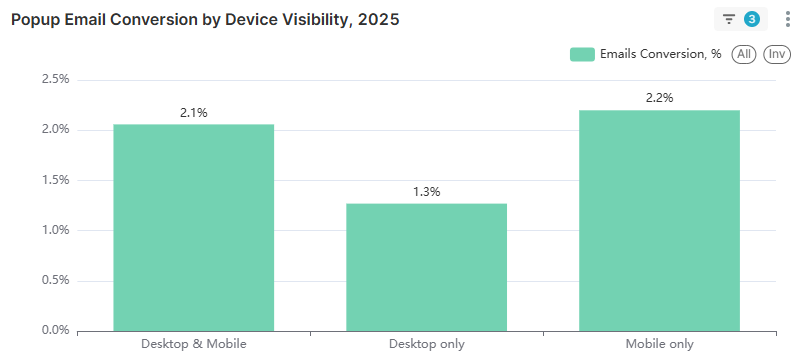
Device targeting has a surprisingly large impact on conversion. In 2025, popups shown on both desktop and mobile converted at 2.2%, and mobile-only popups also averaged 2.2%. But desktop-only popups lagged far behind at 1.4%.
That gap is a strong signal: if your popup strategy ignores mobile, you’re likely missing the highest-intent slice of modern ecommerce traffic. Mobile shopping habits are now the default for many categories, and visitors expect fast, thumb-friendly experiences. A desktop-only form can also be a sign the popup isn’t properly optimized for smaller screens — so it never gets shown where it matters most.
What to do: don’t restrict popups to desktop only. Make sure your form is mobile-responsive, easy to close, and doesn’t overwhelm the screen. For practical design patterns and mobile-specific do’s and don’ts, see our guide to mobile-friendly popup design.
Do discount offers improve popup conversions?
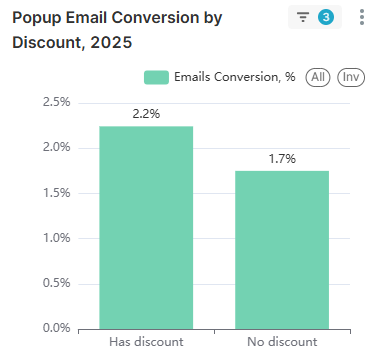
Yes — discounts are one of the strongest drivers of higher popup conversion rates in our 2025 benchmarks. Popups with a discount offer converted at 2.4%, compared to 1.7% for popups without any discount.
That difference equals a 41% relative lift in conversion rate (2.4% vs. 1.7%). The reason is simple: popups work best when the “value exchange” feels obvious. Visitors are being asked to share personal information (their email), so a clear benefit — like 10% off, free shipping, a gift with purchase, or early access — reduces hesitation and increases signups.
What to do: when it fits your margins and brand, lead with a tangible incentive. And if discounting isn’t an option, still offer something of value: a short how-to guide, a product finder quiz result, a back-in-stock alert, or exclusive drops. The key is making the signup feel like an immediate win, not just “subscribe for updates.”
Targeting specific pages with popups
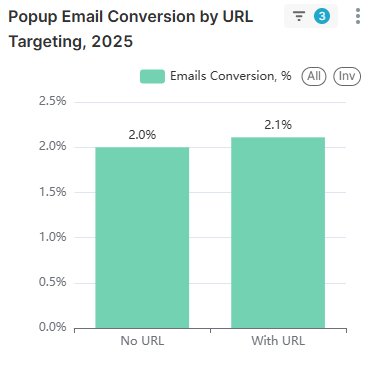
In 2025, popups that used URL targeting converted at 2.4%, compared to 2.0% for popups shown without page-based targeting. That lift reinforces a consistent rule of conversion: relevance beats reach.
When a popup matches the page context — like showing a first-order discount on a product page, a category-specific offer on a collection page, or a content upgrade on a blog post — it feels helpful rather than random. Generic, sitewide popups can still work, but they often speak to nobody in particular. Targeted popups can also align with intent: new visitors, high-interest categories, or shoppers who are clearly browsing a specific problem or product type.
What to do: build different popups for different page types and tailor the message to what the visitor is viewing. If you want inspiration for formats and messaging angles, browse these website popup examples for ecommerce and adapt the patterns to your own high-traffic pages.
Countdown timers: Urgency that converts?
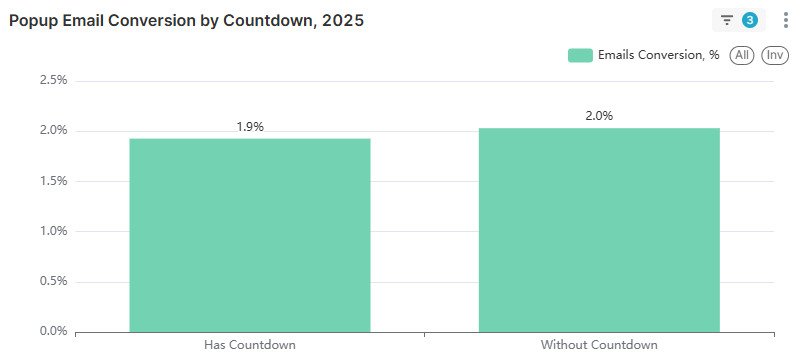
In our 2025 benchmarks, popups with a countdown timer converted at 1.9%, while popups without a countdown averaged 2.1%. That’s a small but meaningful drop — and it’s a useful reminder that urgency isn’t universally persuasive.
A likely explanation is trust. If the countdown feels artificial (“Hurry, offer ends in 10 minutes!” every time you visit), some visitors read it as manipulative and disengage. Timers can also add visual noise, especially on mobile, making the popup harder to scan quickly. This runs counter to some marketing claims that countdowns reliably boost conversions — but in aggregate, we saw the opposite.
What to do: don’t assume countdown timers are a free win. Test them carefully and use them when the urgency is real and easy to understand — like flash sales, limited-quantity drops, or shipping cutoffs. For evergreen offers (like “10% off your first order”), a clean value proposition and strong relevance often outperform a ticking clock.
Wheel of Fortune popups: Do they work?
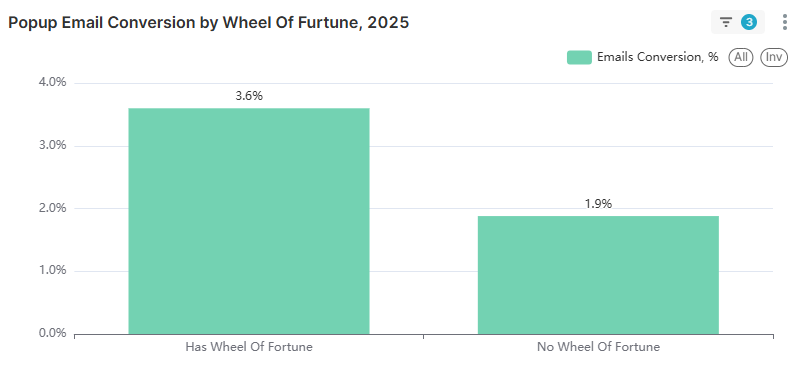
Yes — and in our 2025 benchmarks, this was the biggest conversion lever by far. Popups that used a Wheel of Fortune format converted at 3.5%, compared to 2.0% for popups without it. That’s nearly a 2x uplift, making gamification the single highest-impact variable in this dataset.
Why does it work? Spin-to-win popups change the visitor’s mindset from “I’m being asked for my email” to “I’m about to get a reward.” The interactive step also creates micro-commitment and curiosity: once someone starts the spin, they’re invested in seeing the result. Even when the prize is a standard discount, the experience feels more fun and personalized, which reduces resistance and increases completions.
There’s also a practical advantage: the wheel naturally supports multiple reward tiers (for example, 5%, 10%, free shipping, or a small gift), which can make the offer feel richer than a single flat discount.
What to do: if your priority is fast list growth, test a gamified popup as a primary acquisition format. You can launch this without custom development using Omnisend’s Wheel of Fortune popup template and compare performance against your current signup form.
Choosing the right popup trigger for your goals
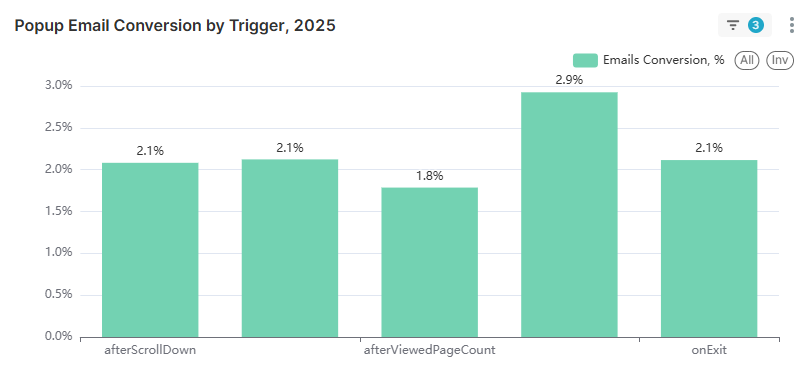
Trigger choice changes who sees your popup — and when they see it — so it’s not surprising that conversion rates vary by trigger type. In our 2025 benchmarks, “engagement-based” triggers generally outperformed exit intent:
- afterScrollDown: ~2.1%
- afterViewedPageCount: ~2.3%
- onExit: ~1.8%
- Other trigger: ~2.9%
The pattern here is intuitive. Exit-intent popups often function as a “last resort” message that appears when visitors are already leaving. Many of those visitors are disengaged, distracted, or in a hurry — so fewer of them convert, even if the offer is strong. By contrast, scroll-based or page-count triggers tend to catch visitors during active browsing, when interest is higher and the popup feels more relevant to what they’re currently doing.
That said, lower email capture rate doesn’t mean exit intent is useless. Exit intent can be highly valuable for cart recovery and abandonment prevention, where the goal isn’t just email collection — it’s saving revenue that would otherwise walk away.
How to use this: choose triggers based on intent. For list growth, start with scroll or page-view triggers. For recovery and last-chance offers, keep exit intent in your toolkit — just measure success beyond signup rate alone.
How placeholder placement impacts signups
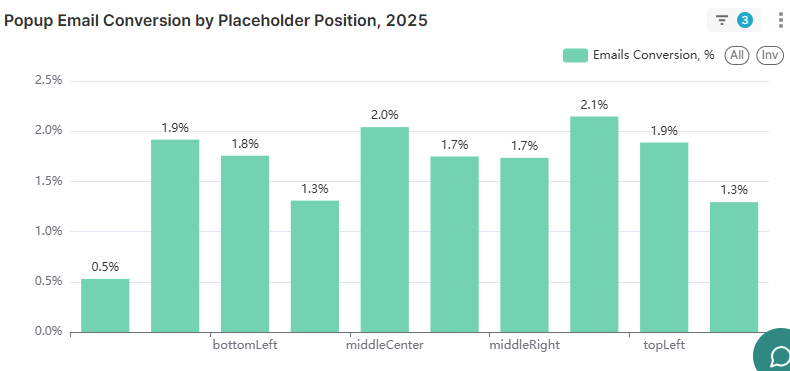
Popup placement isn’t the biggest conversion lever, but it still shapes how intrusive (or natural) the experience feels. In our 2025 benchmarks, conversion rates varied by position, with left-side placements generally performing better than right-aligned or centered options:
- bottomLeft: 1.9%
- middleCenter: 1.8%
- middleRight: 1.7%
- bottomRight: 1.8%
- topLeft: 2.1%
- topRight: 1.3%
- Other position: 2.2%
The main takeaway: placement matters less than content and timing, but it can provide a small edge. Left-side positions (especially top-left) slightly outperformed centered and right-aligned placements, which may be because they feel less like a “hard stop” and more like a contextual prompt. By contrast, top-right performed the worst in this dataset.
What to do: start with a proven placement (like top-left or bottom-left) and then optimize around the bigger drivers — offer, targeting, and trigger timing.
Year-over-year popup performance: 2024 vs. 2025
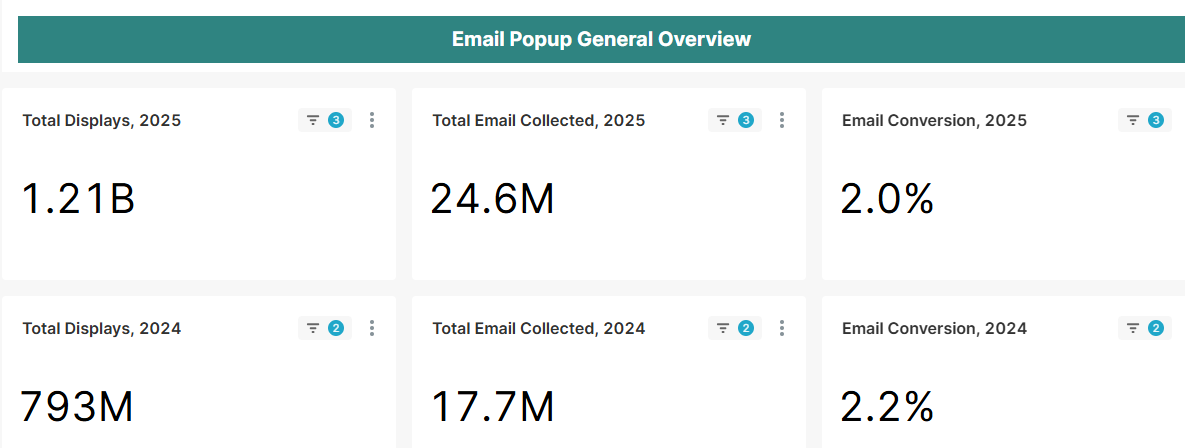
Comparing 2024 to 2025 shows a clear story: popups are being used far more widely, and they’re collecting more emails overall — but average conversion rate has softened slightly as adoption accelerates.
Here are the year-over-year changes in this dataset:
- Total displays: 803M → 1.24B (+54%)
- Total emails collected: 18.3M → 26.4M (+44%)
- Average conversion rate: 2.3% → 2.1% (slight decline)
The growth in display volume is the most telling signal. A 54% jump suggests that more merchants added popups in 2025, and/or more stores increased how often they show them. At the same time, email collection rose 44%, which confirms that popups are still doing their primary job: turning traffic into subscribers at scale.
So why the conversion dip? One likely explanation is maturity. When adoption surges, a larger share of the dataset comes from newer implementations — forms that may be running with default settings, generic messaging, or minimal targeting. Mature programs tend to improve over time through segmentation, better offers, smarter triggers, and iterative design changes. When more “new” popups enter the mix, the overall average can drop — even if top performers continue to improve.
Takeaway: as popups become ubiquitous, optimization becomes the differentiator. The competitive edge is no longer “having a popup”—it’s using the right format, timing, targeting, and value exchange to earn the signup.
How to improve your email popup conversion rate
If 2025’s average popup conversion rate (2.1%) feels “fine but not great,” the fastest path upward is to focus on the levers that showed the biggest, most consistent lifts in the benchmarks. Here are priority-ranked actions you can apply in order—starting with the highest-impact changes first.
- Implement gamification (highest lift). Wheel of Fortune popups averaged 3.5% vs. 2.0% without—about 75% higher conversion. The interaction turns “give me your email” into “win a reward,” which increases engagement and completions.
- Offer a discount or clear incentive. Discount popups converted 2.4% vs. 1.7% without an incentive (41% relative lift). If discounts aren’t an option, use another value exchange (free shipping, early access, a useful guide, or a quiz result).
- Time your popup for the 6–10 second sweet spot. The best-performing delay window was 6–10 seconds (2.4%). Immediate popups (0–1s) were lower (1.9%), and delays beyond 30 seconds also tended to underperform.
- Use URL targeting to match context. URL-targeted popups reached 2.4% vs. 2.0% without targeting. Tailor your offer and message to page intent (product pages, collections, content pages) instead of relying on one generic popup everywhere.
- Limit your form fields to 1–3. One to three fields performed similarly (~2.1–2.2%), but conversion dropped hard at 4 fields (1.5%) and 5+ (1.4%). Collect only what you truly need upfront.
- Optimize for mobile (or you’ll leave conversions behind). Desktop-only popups averaged 1.4%, while mobile-only and desktop+mobile both averaged 2.2%. Keep the design thumb-friendly, fast to read, and easy to close.
- Consider multi-step forms for higher completion. Multi-step popups outperformed single-step (2.3% vs. 2.0%). A simple first click or preference selection increases commitment and boosts signup completion.
- Test before assuming (use benchmarks as direction, not destiny). Even when aggregate data looks counterintuitive (like A/B testers averaging slightly lower), testing is still how you find winners for your audience. Run clean experiments, change one variable at a time, and roll out the winner quickly.
For a deeper, step-by-step playbook that pairs strategy with execution ideas, see our guide to popup conversion best practices.
Methodology
This analysis is based on anonymized performance data from the Omnisend popup platform across the 2025 calendar year, with year-over-year comparisons to 2024. The dataset includes 1.24 billion popup displays and the resulting email signups captured through popup-type forms.
To keep benchmarks representative and reduce distortion from edge cases, we excluded phishers, bad actors, and test accounts, as well as deleted or disabled forms. We also applied a minimum activity threshold of 1,000 yearly views per form to avoid small-sample noise, and removed extreme 50%+ conversion outliers that could skew averages.
This article was researched and written by our experts following a precise process.
See the processTABLE OF CONTENTS
TABLE OF CONTENTS

Subscribe and don’t miss any updates!
No fluff, no spam, no corporate filler. Just a friendly letter, twice a month.