
 OFFER
OFFER


SMS compliance checklist: The 2026 ecommerce guide
With over 130+ pre-built integrations and flexible APIs, you can easily centralize data from across your tech stack
Make the most out of your data and unlock powerful growth marketing possibilities with these other top marketing tools.
Build any custom integration with our open, flexible APIs that are simple to use and implement.
Check out apps that have been stealing all the spotlight.
Email and SMS marketing insights, ecommerce resources, and the latest Omnisend news
Expert-led sessions covering email, SMS, and ecommerce marketing strategies.
Educational video and live training to help you make the most out of Omnisend.
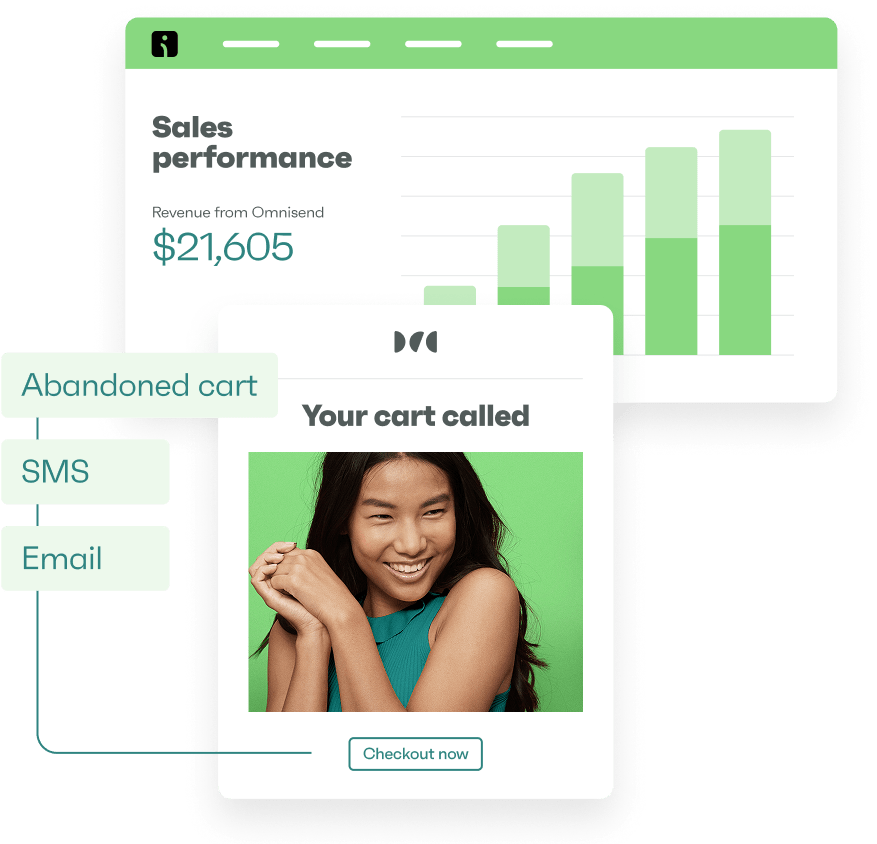
Drive sales on autopilot with ecommerce-focused features
See FeaturesSMS analytics is the process of monitoring metrics such as delivery rate, conversion rate, and revenue per send. It’s done to measure and improve the success of text message campaigns.
Marketers typically only assess delivery rate and leave it at that. However, the metrics that forecast revenue are further down the funnel, and very few platforms make them visible.
Without those insights, you can risk losing money. On average, automated SMS messages generate $0.74 per send, whereas campaigns only manage $0.15. That’s a fivefold difference you’ll only know about if you measure the correct metrics.
In this guide, you’ll learn what SMS analytics involves and the key metrics to track in 2026. You’ll also learn the benchmarks that help you evaluate performance, and features that a good SMS analytics tool should have.
Quick sign up | No credit card required
Email analytics often rely on open rates and longer engagement windows. SMS analytics, on the other hand, focuses more on delivery rates, clicks, replies, and conversions. These metrics show how people interact with messages in real time.
The SMS channel is becoming increasingly popular. According to Omnisend’s 2026 Ecommerce Marketing Report, SMS volume grew by another 40% in 2025. These are the four differences between email and SMS analytics that matter most:
The closest equivalents are click and conversion rates, which reflect action rather than attention.
On the other hand, successful delivery in SMS is measured by confirmed delivery to a phone. SMS carriers filter or block text messages based on rules they don’t publish, so the same percentage can hide two separate realities.
Far worse than reducing engagement, an irresponsible campaign can permanently lose you contacts.
To measure SMS revenue, add UTM parameters to your links, then connect your ecommerce platform and enable conversion tracking.
SMS analytics is different from email analytics and should focus on revenue per send as the key metric. When you focus on metrics tied to revenue and conversions, it becomes much easier to understand campaign performance.
Every text message analytics setup comes down to seven metrics — revenue per send, revenue per subscriber, delivery, click-through, conversion, list growth, and opt-out rate. Below, we explain each metric and highlight the factors that influence it.
Here’s where those figures sit inside Omnisend’s SMS report:
SMS delivery analytics tells you how many of your sends actually reached a phone. It comes first because every other SMS marketing analytics metric depends on successful delivery.
Formula: (Delivered messages ÷ sent messages) × 100
Several factors can lower your SMS delivery rate, including:
A healthy SMS delivery rate is typically 95% or higher. If your rate drops below 90%, it usually points to a problem with list quality rather than SMS marketing campaign performance.
Unlike many email deliverability issues, low SMS delivery rates are often easier to fix. Simply clean your list, check phone numbers at signup, and follow carrier rules.
Click-through rate measures the percentage of recipients who click a link in your text message. It helps you understand how effective your message, offer, and call to action are.
Formula: (Clicks ÷ delivered messages) × 100
According to the 2026 Omnisend report, SMS click rates more than doubled year over year. Vagari Bags holds a steady 6- 7% by keeping storytelling in its emails and reserving texts for direct, time-bound offers.
Vagari’s reporting shows what that looks like on a dashboard:
These four factors affect CTR more than anything else:
CTR is a stronger engagement signal in SMS because clicking a link in a text message requires more intent than an email.
Conversion rate measures the number of people who clicked your link and then completed a desired action, such as making a purchase or signing up.
Formula: (Conversions ÷ clicks) × 100
Unlike delivery and click metrics, conversion rate requires deliberate setup. To track it accurately, you need UTM parameters on every SMS link and an integration between your SMS platform and ecommerce store.
Note that the location of your business will affect your conversion benchmarks. As noted in the same 2026 report, SMS campaigns in the UK converted 5.1% of clicks into purchases. The global average, meanwhile, is 0.97%.
A good rule of thumb is to calculate your score based on your geographic market and segments rather than a single worldwide number.
Also, automated text messages convert far better than broadcasts simply because they hit inboxes at the exact moments of intent. Automated messages generate $0.74 per send on average compared to $0.15 for campaigns.
Revenue per send is a measure of how much revenue each text message generates on average. It is considered the north star metric of SMS analytics because it combines delivery, engagement, and conversion into a single business outcome.
Formula: Total SMS-attributed revenue ÷ total messages sent
The gap between campaigns and automations highlights why this metric matters. According to the 2026 report, automated SMS messages generate $0.74 per send on average, while campaigns generate $0.15 per send. That fivefold difference comes from behavioral targeting and better timing.
Top-performing agencies generate $16.70 in annual revenue per subscriber, which shows the long-term value of a well-optimized SMS program. To improve revenue per send, focus on audience segmentation, behavior-based automations, and ongoing A/B testing.
Agencies that test regularly generate 192% more revenue on average than those that do not. Kate Backdrop achieved a 1:300 return on investment with an optimized omnichannel SMS campaign program.
Opt-out rate shows the percentage of recipients who unsubscribe after receiving your messages. It helps you gauge whether your content, targeting, and sending frequency match subscriber expectations.
Formula: (Opt-outs ÷ delivered) × 100
This metric matters more in SMS than in email because SMS opt-outs are carrier-enforced. When a subscriber replies STOP, they are removed immediately and cannot receive future messages unless they actively opt in again.
High opt-out rates can also attract carrier scrutiny and affect deliverability across your entire SMS program.
Aim for below 0.3% opt-outs per send. Opt-out rates exceeding 0.5% indicate a lack of relevance or issues with your message frequency. Analyze each campaign separately, as a single bad blast can be hidden in the monthly average.
The main reasons for your SMS opt-out rates going up are usually one of these four:
Your list growth rate indicates whether the subscribers you are acquiring outweigh the ones you are losing.
Formula: ((New subscribers − opt-outs) ÷ subscribers at period start) × 100
A declining list growth rate usually means fewer people are joining, more subscribers are leaving, or both. This points to a strategy issue that needs attention before your list starts shrinking.
Growing an SMS list quickly is possible with the right signup process. Divatress built an SMS list of nearly 70,000 within eight months, using that strategy.
That said, it’s also okay to build slowly. Headbanger Sports grew its SMS list from 0 to 30,000 in two years, with Vyber Media as its agency partner.
The biggest drivers of list growth include:
Track this metric by month and signup source to understand what is actually driving subscriber growth.
Revenue per subscriber measures the average revenue generated from each contact on your SMS list.
Formula: Total SMS revenue ÷ total SMS subscribers
A smaller list of highly engaged subscribers can outperform a larger list of poorly segmented contacts. For example, 10,000 engaged subscribers can generate more revenue than 100,000 low-quality contacts.
Top agencies earn $16.70 per subscriber each year, according to Omnisend’s Top Agencies research. Also, agencies using SMS generate 202% more revenue than those that don’t. The difference comes from subscriber value rather than list size.
SMS campaign analytics and SMS automation analytics measure different things. Campaigns track planned sends. Automations track messages triggered by user actions.
SMS campaigns are planned in advance and sent to a large segment of your list at once. They should be measured by delivery rate, CTR, revenue per send, and opt-out rate for each send. Since broadcasts are less targeted, lower benchmarks are expected.
Track campaigns by looking at:
Automations are triggered when a subscriber performs a specific action. Because they reach customers at high-intent moments, track conversions and revenue per send.
What to track for automations:
The performance gap between campaigns and automations is significant. Automated SMS generates $0.74 per send on average compared to $0.15 for campaigns. This difference comes from timing and targeting, which create stronger buying intent.
Automation analytics should be held to a higher standard. If an automation performs like a regular campaign, review the trigger, timing, and audience targeting.
SMS analytics benchmarks are reference points for healthy campaign performance. They show what good results look like across key metrics. They also help you see if your performance is strong or needs improvement.
The table below brings together verified data. It is sourced from Omnisend’s 2026 Ecommerce Marketing Report and its Top Agencies research.
| Metric | Healthy benchmark | Warning signal |
|---|---|---|
| Delivery rate | 95%+ as a floor, 98%+ per Omnisend data | Below 90% signals list-quality problems |
| Click-through rate | 3–7% | Below 2% |
| Opt-out rate | Below 0.3% per send | Above 0.5% flags a relevance or frequency issue |
| Revenue per send (campaigns) | Around $0.15 per message | Below $0.10, which may signal low engagement or conversion issues |
| Revenue per send (automations) | Around $0.74 per message | Below $0.30, which may indicate weak triggers or targeting |
| List growth rate | Positive month-over-month growth | Remains flat or declines over time |
These SMS analytics benchmarks should be used as guides, not strict targets. Performance varies based on industry, audience quality, message type, and how often you send.
Market differences also matter. UK SMS campaigns reach a 5.1% click-to-conversion rate, while the global average is 0.97%.
The goal of SMS analytics is to spot trends, find weak areas, and improve results over time.
SMS conversion tracking requires three key steps — adding UTM parameters, connecting your ecommerce platform, and separating campaign and automation tracking. Without this setup, SMS analytics cannot show how your messages drive revenue.
1. UTM parameters on every link
Add UTM tags like utm_source=sms, utm_medium=text, and utm_campaign=[campaign name] to every SMS link. These tags help Google Analytics and ecommerce dashboards track traffic and sales from your text messages.
2. Ecommerce platform integration
Connect your SMS platform with your ecommerce store to link messages with purchases. This connects SMS performance data with actual sales, so you can see which messages drive revenue. Omnisend integrations with Shopify, WooCommerce, and BigCommerce pull sales data into your reports.
3. Separate tracking for campaigns vs automations
Use different UTM campaign values for each. This keeps results from broadcasts and automated flows separate. You can then compare performance without mixing traffic sources.
Accurate tracking gives you a clearer view of what is driving SMS performance. With the right setup, SMS analytics can help you improve campaigns and increase revenue over time.
When choosing an SMS analytics tool, focus on five capabilities — revenue attribution, campaign vs automation reporting, segment-level analytics, A/B test reporting, and delivery analytics.
Here’s a breakdown of the factors:
Omnisend gives you the tools for SMS analytics in one place. You can monitor revenue, campaign results, automation, delivery rates, and A/B test results from a single dashboard. Because SMS and sales data are connected, it is easier to see which messages drive clicks, conversions, and revenue.
This was the structure Divatress used to grow its SMS list to almost 70,000 and to see automated messages drive 54% of its Omnisend-powered revenue. Attribution at that level of granularity is only uncovered at the platform level, where sends and purchases are linked.
Small differences in performance can add up quickly. For example, a campaign generating $0.74 per send will deliver far more value than one generating $0.15 per send.
Without proper reporting, those differences are easy to miss. Start measuring today and compare your results with the benchmarks in this guide.
Quick sign up | No credit card required
SMS analytics is the process of tracking how your text message campaigns perform. It measures key metrics such as delivery rates, clicks, conversions, and revenue. The data shows what is working and what needs improvement.
You should track these seven metrics:
Revenue per send is the core metric to focus on. It combines deliveries, taps, and orders into a single number you can compare across campaigns, automations, and months.
While there isn’t an ideal figure for everyone, active ecommerce lists get 67%, which is the level Vagari Bags gets from its SMS campaigns. Benchmarks also change over time.
Omnisend’s 2026 Ecommerce Marketing Report found that SMS click rates more than doubled year over year. As a result, a click rate that looked strong in 2024 may be considered average today.
You’ll need to add UTM parameters to every link. Integrate SMS analytics into your ecommerce platform, and track campaigns and automations separately.
Campaign analytics measures one-time broadcasts, while automation analytics tracks trigger-based messages. Also, campaigns are assessed mainly on delivery, click-through, and revenue per send. On the other hand, automations are judged on conversion rate and revenue per send.
TABLE OF CONTENTS
TABLE OF CONTENTS
What’s next


No fluff, no spam, no corporate filler. Just a friendly letter, twice a month.