
 OFFER
OFFER


What is omnichannel marketing? Examples, tips & tools
With over 130+ pre-built integrations and flexible APIs, you can easily centralize data from across your tech stack
Make the most out of your data and unlock powerful growth marketing possibilities with these other top marketing tools.
Build any custom integration with our open, flexible APIs that are simple to use and implement.
Check out apps that have been stealing all the spotlight.
Email and SMS marketing insights, ecommerce resources, and the latest Omnisend news
Expert-led sessions covering email, SMS, and ecommerce marketing strategies.
Educational video and live training to help you make the most out of Omnisend.
Drive sales on autopilot with ecommerce-focused features
See FeaturesIt is a common myth that simply tracking ecommerce metrics is enough to achieve ecommerce success.
The truth is, it’s crucial to have a deeper understanding of the insights gained. Understanding ecommerce metrics allows you to evaluate the performance of your online business accurately.
By analyzing the data behind specific ecommerce metrics, you can identify strengths, weaknesses, and areas for improvement. Only then will you be able to make informed business decisions that drive growth
To help you navigate the complex realm of ecommerce metrics and KPIs, we have compiled a list of key ecommerce marketing metrics that you must measure.
Get the full email, SMS, and push marketing statistics report for ecommerce in 2023, where we analyzed more than 17.3 billion messages
Get my copy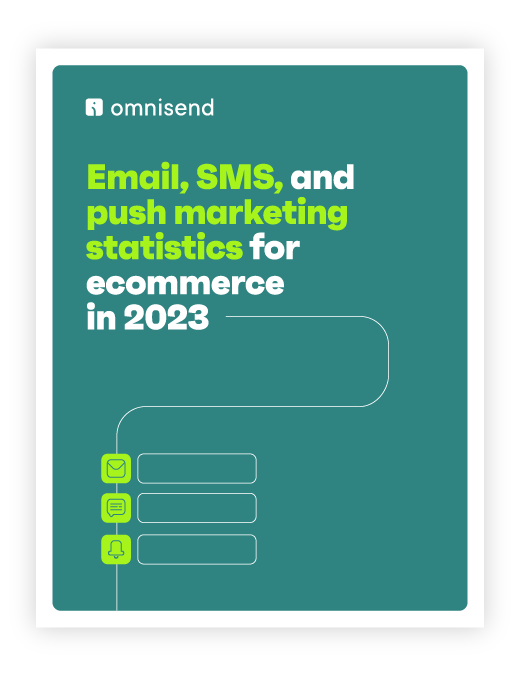
We’ll also delve into each metric, helping you understand their importance and use them as a foundation for strategic action plans.
So, let’s dive in:
Quick sign up | No credit card required
Ecommerce metrics play a crucial role in any ecommerce marketing strategy. They can help you track the performance of your ecommerce website by quantifying things like how many people visit your website, the size of average purchase, or how many customers return to your brand.
On the other hand, ecommerce KPIs (key performance indicators) are very specific factors that you track to determine where your business stands in comparison to its goals. You pre-determine your KPIs based on business goals and then track them to follow your progress.
While KPIs are specific, measurable, achievable, realistic and time-bound (SMART) objectives, ecommerce metrics are just data points related to your business, and might not be linked to a particular goal.
For example, the average order value of your store is an ecommerce metric, but an average order value of $30 is a KPI.
In simple English, ecommerce metrics track your business progress, and KPIs show how effective you are at achieving your goals. KPIs are goal-oriented, and they use ecommerce metrics to measure how close or far away you are from reaching those goals.
This means: All KPIs are ecommerce metrics, but not all metrics for ecommerce are KPIs.
The table below summarizes the differences between ecommerce metrics and KPIs.
| Ecommerce Metrics | Ecommerce KPIs | |
| Definition | Quantifiable data points that show how your online store is doing, but they may not be related to your goals | Specific, strategic performance measurements that tell you if you’re meeting your goals. They’re based on the goals you set |
| Purpose | Help you understand different parts of your online store and its overall performance | Evaluate the achievement of key business objectives by tracking where you currently stand |
| Focus | Can include site traffic, bounce rate, conversion rate | Directly tied to online sales, customer retention, and ROI |
| Alignment | May not directly align with sales goals | Directly aligned with sales targets and business objectives |
| Importance | Important for optimizing website and user experience | Critical for assessing overall ecommerce business success in meeting the set goals |
| Time Sensitivity | Can be real-time or historical data | Often time-bound, reflecting short-term and long-term goals. The data would likely be for a specific period |
| Examples | Page views, click-through rate, cart abandonment rate | Conversion rate, average order value, customer lifetime value |
Let’s see what the key ecommerce metrics and KPIs are that you can’t ignore:
1. Cost per acquisition (CPA)
3. Average order value (AOV)
7. Customer retention rate (CRR)
8. Customer lifetime value (CLV)
10. Unsubscribe rate
11. Net promoter score (NPS)
13. Ecommerce store sessions by traffic source
14. Bounce rate
Cost per acquisition is the total cost you spend on acquiring a new customer.
This can be calculated with a simple formula:
Cost per acquisition = Total money spent / New customers acquired
Here’s an example of how to calculate CPA:
In November, Jack invested $10,000 in marketing for his online shoe store. He was able to acquire 500 new customers.
Jack’s CPA will be $10000/500 = $20.
This means that Jack spent 20 dollars to acquire one customer in November.
Note: To have a profitable ecommerce store, the average order value should always be greater than the cost per acquisition. In simple terms, you shouldn’t pay more to get a customer than they spend on your store.
The cart abandonment rate is the percentage of people who have visited your store and added a product to their shopping cart, but didn’t buy it.
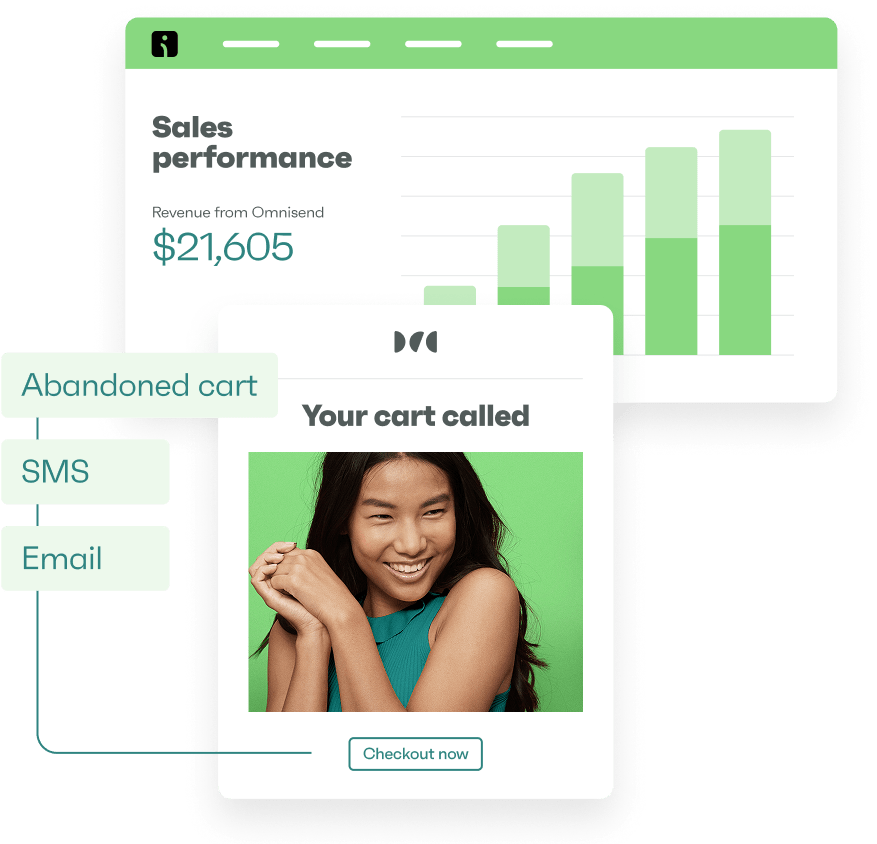
Using a platform like Omnisend to automatically send cart abandonment emails to catch those shoppers can help with converting abandoners into buyers.
The cart abandonment rate also gives you a good idea of how well your checkout process is performing and can provide insight into whether your product or shipping costs are potential reasons for abandoning carts.
To calculate your cart abandonment rate, you would use the following formula:
Cart abandonment rate = 1 – (Total purchases made / Total shopping carts created) x 100
 | Amundsen Sports used Omnisend to power their email marketing campaigns. They deployed it for cart abandonment emails and got a staggering 57% conversion rate even without offering a discount. These emails accounted for only 0.9% of all emails but drove 10.8% of their email revenue! Find out more: How Amundsen Sports’ focus on identity leads to more sales after the order |
AOV is the average amount of money spent each time a customer orders something from your store. This can be for one product or multiple products bought together in one order.
The formula for AOV is quite straightforward:
Average order value = Revenue / Number of orders
Tracking AOV as an ecommerce metric helps you set benchmarks and goals for the future.
Some marketers consider it to be one of the key ecommerce metrics. Why?
It’s because you don’t have to spend any money to increase your AOV. All you have to do is get shoppers to buy more products in each order, via tactics like upselling and cross-selling, free shipping, or incentives to buy multiples.
Use these tips to increase your AOV:
The ultimate guide to discount pricing strategies
Flash sale: guide you need to sell out every time [+Examples]
How to cross-sell retail products
The click-to-open rate is an ecommerce marketing metric that shows the percentage of people who clicked your CTA after opening your email. It’s the best way to measure your campaign’s success, and you can use this ecommerce metric for other channels as well, including SMS.
You can do so with this formula:
Click to open rate = (Unique clicks / Unique opens) x 100
By measuring the click-to-open rate, you get an idea if your emails have engaging content, an effective CTA, and ease of interaction.
Note: For any email campaign you run, the click-to-open rate depends on the receivers and how active they are at a given time. So choose your sending date and time wisely.
 | To’ak Chocolate used Omnisend to promote their products. Through automation, their click-to-open rate grew by 9% and led to a 460% increase in sales from email. They achieved a revenue-per-email (RPE) of $5.66. Read more: How To’ak Chocolate increased their revenue using Omnisend |
For any ecommerce business, the ultimate goal is to make a sale, and that’s why tracking your email conversion emails is the most important metric for ecommerce.
The conversion rate can be calculated as:
Email conversion rate = Number of sales / Number of emails sent
You can further multiply the result by 100 to get a percentage value.
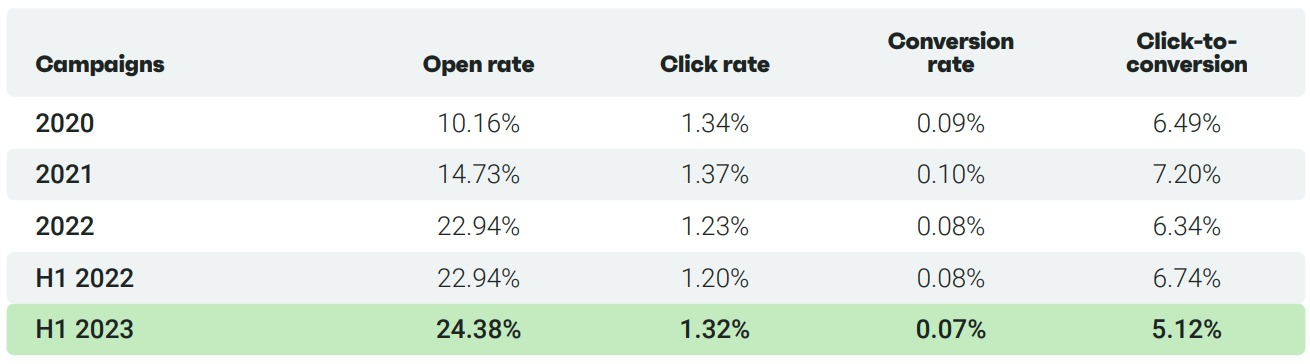
Here’s what conversion rate you can expect from your email campaigns. Track it along with other essential email-specific ecommerce metrics to understand where your campaign stands.
 | Naked & Famous achieved an enviable 24% conversion rate for their campaigns through automation powered by Omnisend—translating to 20% of their email revenue. Find out how: Read case study |
This metric for ecommerce is all about determining how well your email opt-ins work. These include both popups and email signup forms.
If your email opt-in rate is low, it likely means that your opt-in forms aren’t on point. You may need to improve your copy and make the forms more intuitive to increase the chances of your visitors converting.
The placement and timing of your popups and forms also matter. For instance, using exit-intent popups might be a better bet than triggering them immediately when a visitor lands on your website.
Here’s a straightforward formula to help you calculate this ecommerce performance metric:
Email opt-in rate = (Number of people who subscribe) / (Number of visitors to your site) x 100
Strategies to give your email opt-in rate a boost:
3 ways to use smart popups for better conversions
30 killer exit intent popup examples you can steal (& best practices)
When it comes to ecommerce, the customer retention rate represents the number of customers who buy from you repeatedly over a given period of time.
To calculate CRR, you need to have three values:
When you have all the three values, just put them in the formula below:
Customer retention rate = (E – N / S) x 100
Did you know: The retention rate for marketers using three or more channels comes out to be 66%—much higher than 34.8% for marketers relying on a single channel.
CLV represents the total amount of money a shopper is expected to spend on your store’s products or services in their lifetime as your customer.
Knowing CLV is crucial as it helps you decide about your investment for CPA and CRR optimization.
You can calculate your CLV by finding your AOV, the number of times customers buy from you every year, and the average length of a customer relationship. Multiplying these gives you the CLV:
CLV = Average order value x No. of times the customer will buy from you each year x The average length of the customer relationship (in years)
By calculating, tracking, and improving your CLV, you can increase your revenues and drive business growth.
So suppose a baseball player buys a bat worth $200 from your store three times a year.
He does the same for five years. Therefore his CLV would be:
CLV = $200 X 3 X 5 = $3000
Get more details: How to calculate customer lifetime value (CLV)
The ecommerce churn rate is a calculation of the percentage of customers a business loses in a given time frame. The formula is:
Churn rate = [(Number of customers in the beginning – Number of customers in the end) / Number of customers in the beginning] x 100
If you have 200 sales at the start of November and it drops to 180 at the end of the month, the ecommerce churn rate will be [(200-180) / 200] x 100 = 10%.
Learn how to reduce your churn: How to identify high-risk customers and reduce churn
Gaining new subscribers through your campaigns is one thing but retaining them is a completely different ball game. That’s where the unsubscribe rate comes into play.
The unsubscribe rate helps you calculate the percentage of existing subscribers who unsubscribe from your list (email, SMS, push notifications, etc.) after a campaign. The lower this rate, the better you’ve performed at retaining your subscribers through your marketing.
You can calculate your unsubscribe rate with this formula:
Unsubscribe rate = (Number of unsubscribes / Number of messages delivered) x 100
In ecommerce, you can expect around a 0.3% unsubscribe rate with email marketing.
The net promoter score is a metric for ecommerce that tells you how many customers are willing to recommend your product to others.
Tracking this will give you a clear understanding of where your business is in terms of customer satisfaction and brand loyalty.
To calculate the NPS, you need to understand what promoters and detractors are.
Your promoters are your loyal customers who recommend your products to their friends and family, whereas the detractors are the unhappy customers who won’t be recommending you to anyone.
NPS = %Promoters – %Detractors
The sales conversion rate is a key ecommerce performance metric that measures the percentage of website visitors who make a purchase.
It helps you evaluate the effectiveness of your online sales strategies and the overall performance of your website.
The formula to calculate the ecommerce sales conversion rate is as follows:
Conversion rate = (Number of conversions / Number of website visitors) x 100
A high sales conversion rate indicates that a higher proportion of visitors are converting into customers. On the other hand, a low sales conversion rate could be due to factors like poor website design, a difficult checkout process, and more.
If your sales conversion rate is low, we recommend looking at your entire ecommerce sales funnel.
If you have low web traffic, it indicates the need to improve your marketing efforts to drive more visitors to your website. Similarly, if visitors abandon their carts, it could be due to unexpected shipping costs, complex checkout processes, or concerns about payment security.
Ideally, your sales conversion rate should stay steady or increase over time. If that’s not the case, thoroughly investigate to ensure your website works properly.
Tracking ecommerce store sessions by traffic source is crucial in seeing how people land on your site. It’s also helpful in evaluating the effectiveness of your marketing efforts.
It involves monitoring and categorizing the incoming traffic based on the channels users reach your store.
These may include:
By identifying the traffic sources, you can determine which marketing channels generate the most visitors and accordingly set your budgets for each.
You can use Google Analytics for tracking this ecommerce performance metric. Just head to Reports > Acquisition > Traffic acquisition to find the number of visitors coming in from each source.
Bounce rate is a critical ecommerce metric that measures the percentage of visitors who land on your online store but leave without interacting further or making a purchase. As they leave (or “bounce”) before visiting any other page on your website, this metric provides insight into the effectiveness of your website’s landing page in retaining visitor interest.
The formula for calculating bounce rate is:
Bounce rate = (Number of single-page visits / Total visits) x 100
A high bounce rate indicates that your pages aren’t holding visitor interest or nudging them to explore your store further. To improve this ecommerce metric, focus on optimizing your landing page, ensuring it’s user-friendly, loads quickly, and provides relevant content, ultimately encouraging visitors to explore and convert into customers.
Learn how to reduce your bounce rate: Customer engagement marketing: Your 101 guide [+ Examples]
Every ecommerce metric needs a different tracking frequency. Some ecommerce metrics need to be tracked weekly, while it’s okay for some to be tracked quarterly.
Here are the four timeframes one could track ecommerce metrics:
Ecommerce metrics and KPIs provide valuable insights into the performance of your ecommerce business, and serve as a compass guiding your strategic decisions.
Start by identifying the key goals and objectives for your ecommerce business. They’ll help you determine which ecommerce metrics to focus on and how to measure them effectively.
Choose ecommerce metrics that provide meaningful insights into your business performance. And then track them regularly to ensure you’re always updated with the latest trends.
Lastly, invest in robust email and SMS marketing tools like Omnisend that help you gather data and track your ecommerce metrics.
With its comprehensive features and user-friendly interface, Omnisend can provide valuable insights and assist in implementing effective marketing strategies. Get started with Omnisend for free to start tracking your ecommerce metrics.
TABLE OF CONTENTS
TABLE OF CONTENTS
What’s next


No fluff, no spam, no corporate filler. Just a friendly letter, twice a month.